
What is a timeframe in trading?
In one line: The timeframe is how much time each candle on a chart covers — one minute, five minutes, one hour, one day, and so on.
A simple example
On a 5-minute chart, each candlestick shows five minutes of trading: where price opened, the highest and lowest it went, and where it closed.
The US stock market's regular session runs 6.5 hours, from 9:30 am to 4:00 pm ET. That's 78 five-minute candles in one day.
On a daily chart, that whole day is squeezed into one candle. Same market, same day — one picture has 78 pieces, the other has one.
Why it matters
Different timeframes tell different stories. A stock can look like it's falling on a 5-minute chart while the daily chart shows a steady uptrend. Both are true; they just zoom in to different depths.
As a rule of thumb, the bigger the timeframe, the more a level or a trend matters. More traders see it, and it took more buying and selling to build.
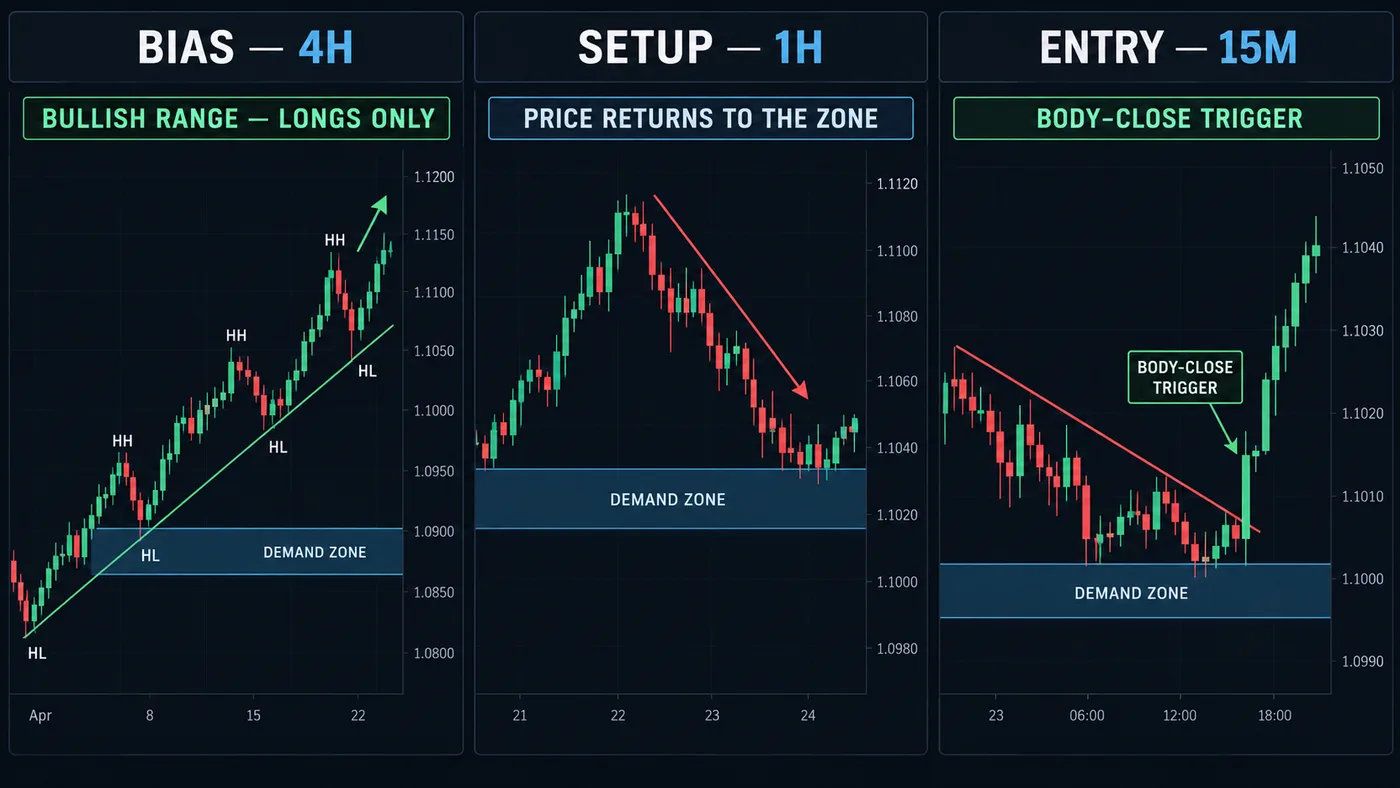
That's why we check the bigger chart first and trade in its direction. The full method is in multiple timeframe analysis.
Matching the timeframe to your style
- Scalping: 1-minute or tick charts.
- Day trading: often 5-minute or 15-minute charts, with an hourly or daily for direction.
- Swing trading: hourly, 4-hour and daily charts.
There's no single right one. See the best timeframe for day trading for how to choose.
A common mistake
Flipping charts until one agrees with you. The 5-minute says no, so you check the 2-minute, then the 1-minute, until something looks like a buy. That's not analysis — it's searching for permission.
Pick your timeframes before the session starts and write them in your plan. One for direction, one for the entry. Stick to them.
Questions
What is the best timeframe for beginners?
Slower charts, like the hourly or daily, give you more time to think. Many beginners find that calmer to learn on.
Do candles on different timeframes close at different times?
Yes. A 5-minute candle closes every five minutes; a daily candle closes once at the end of the session.
What's a higher timeframe?
Any chart where each candle covers more time than the one you trade on. It's used to see the bigger direction.
Want the next step? We'll walk you through it.
Four free lessons by email, one every few days — each with a 10-minute exercise on a real chart.
Send Me the Free Lessons 4 short emails · No spam · Unsubscribe anytimeOr see the whole method, step by step:
See What’s Inside the Course Try everything free first. Decide when you're ready. · Open the free chart tool (works in the TradingView phone app)One chart idea a day, in plain English. Follow along: