
Home › Guides › Reading charts
Multiple timeframe analysis: big chart first, then zoom in
One market can look like it's rising on one chart and falling on another. Both are true. The trick is to read them in the right order.
Why one chart isn't enough
A timeframe is how much time each candle covers: 5 minutes, 1 hour, 1 day. Change it, and the chart can tell a different story.
Picture a staircase going up. Up close, you might be standing on a step that dips a little. Step back, and the whole staircase still climbs. The small dip is real — it's just not the main direction.
Multiple timeframe analysis means looking at the staircase first, then the step.
The idea in one line
Big chart for direction. Smaller chart for the spot. Trade with the big chart, not against it.
The three charts and their jobs
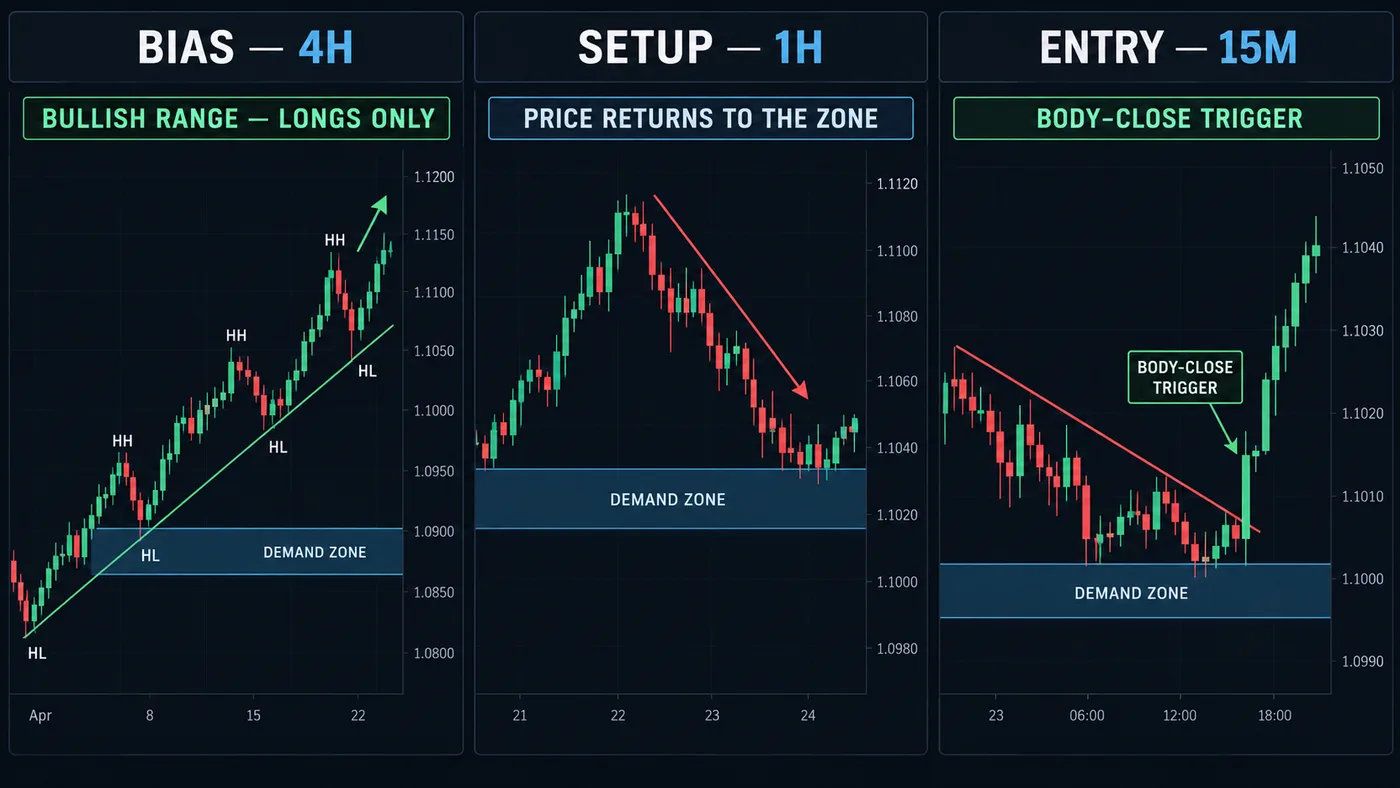
Many traders use three charts, each with one job:
- The big chart — direction. Is price in an uptrend, a downtrend or a range? This sets which side you look for. See how to identify a trend.
- The middle chart — the zone. Where might price react? Mark the floors, ceilings and supply and demand zones here.
- The small chart — the trigger. When price reaches the zone, what does it do? This is where you look for a candle body close that shows price turning your way.
Two charts work fine too. Just keep the jobs separate.
Common pairings
A handy rule of thumb: each chart is about 4 to 6 times bigger than the next one down.
| Style | Direction | Zone | Trigger |
|---|---|---|---|
| Swing trading | Weekly | Daily | 4-hour |
| Slower day trading | Daily | 1-hour | 15-minute |
| Day trading | 4-hour | 1-hour | 15-minute |
| Faster day trading | 1-hour | 15-minute | 5-minute |
None of these is "the best." Pick one row and stay with it long enough to learn it. More on picking in the best timeframe for day trading.
Step by step
- Start on the big chart. Mark the last few turning points. Higher highs and higher lows? Uptrend — you look for buys. Lower highs and lower lows? Downtrend — you look for sells. Neither? Range — many traders wait. The full method is in higher highs and higher lows.
- Move to the middle chart. Mark the one or two zones where price is likely to react, in line with the big chart. In an uptrend, that's the floors below price.
- Wait. Nothing happens until price reaches your zone. Most of the time, this is the step.
- Drop to the small chart when price arrives. Watch for price to stop falling, then for a candle body to close back up through the last small turning point. That's the sign the small chart is turning the big chart's way.
- Place the stop from the chart. Just past the zone, where the idea is wrong. Size it with the position size calculator.
A described example
An illustration, not a real trade. A currency pair:
- 4-hour: higher highs and higher lows. Direction: up. Look for buys only.
- 1-hour: price pulls back toward a demand zone at 1.0900–1.0920.
- 15-minute: price reaches the zone, falls for a bit, then a candle body closes above the last small peak at 1.0935.
All three charts now agree. The stop goes below 1.0900, past the zone. If a 15-minute or 1-hour body closes below 1.0900, the idea is over. It can still lose even with everything lined up — agreement makes the picture clearer, not certain.
When the charts disagree
They often will. Some simple rules:
- Big chart up, small chart down: the small move is usually a pullback. Wait for it to end, then look for buys.
- Big chart in a range: there's no clear direction. Many traders sit out or trade only the edges.
- Small chart signal against the big chart: that's swimming upstream. Most beginners do better skipping these.
Don't go hunting. If you flip between ten charts until one agrees with you, you're not analyzing — you're shopping for permission. Pick your three charts before you look.
Common beginner mistakes
- Starting small. Looking at the 1-minute first, getting excited, then checking the big chart to justify it.
- Too many timeframes. Five charts give five opinions. Two or three is enough.
- Charts too close together. A 5-minute and a 3-minute chart say almost the same thing.
- Forgetting news. Big data releases can swamp every chart at once. Check the calendar — see how to read an economic calendar.
Our free chart tool marks the turning points on whatever chart you open, so step 1 takes seconds on each one. Add it on TradingView.
Try it today
- Pick one row from the pairings table.
- Open one market on all three charts, side by side.
- Write the big chart's direction in one word: up, down or range.
- Mark one zone on the middle chart.
- Don't act. Just watch what the small chart does when price reaches the zone.
Questions
What is multiple timeframe analysis?
It's reading the same market on two or three charts of different sizes. The bigger chart sets the direction, and the smaller chart helps you find a spot to act.
What timeframes should I use together?
Pick charts about 4 to 6 times apart, like daily, 1-hour and 15-minute. The exact set matters less than using the same one every time.
Which timeframe should I trust most?
The bigger chart usually carries more weight. When the small chart disagrees with it, the small move is often just a pause in the bigger trend.
How many timeframes are too many?
More than three usually adds noise. Two or three charts, each with one clear job, is plenty.
Want the next step? We'll walk you through it.
Four free lessons by email, one every few days — each with a 10-minute exercise on a real chart.
Send Me the Free Lessons 4 short emails · No spam · Unsubscribe anytimeOr see the whole method, step by step:
See What’s Inside the Course Try everything free first. Decide when you're ready. · Open the free chart tool (works in the TradingView phone app)One chart idea a day, in plain English. Follow along: