
Home › Guides › Reading charts
Higher highs and higher lows: how to read a trend yourself
Every chart is built from the same few moves. Price climbs, dips, and climbs again. Once you can see that pattern, a messy chart starts to make sense.
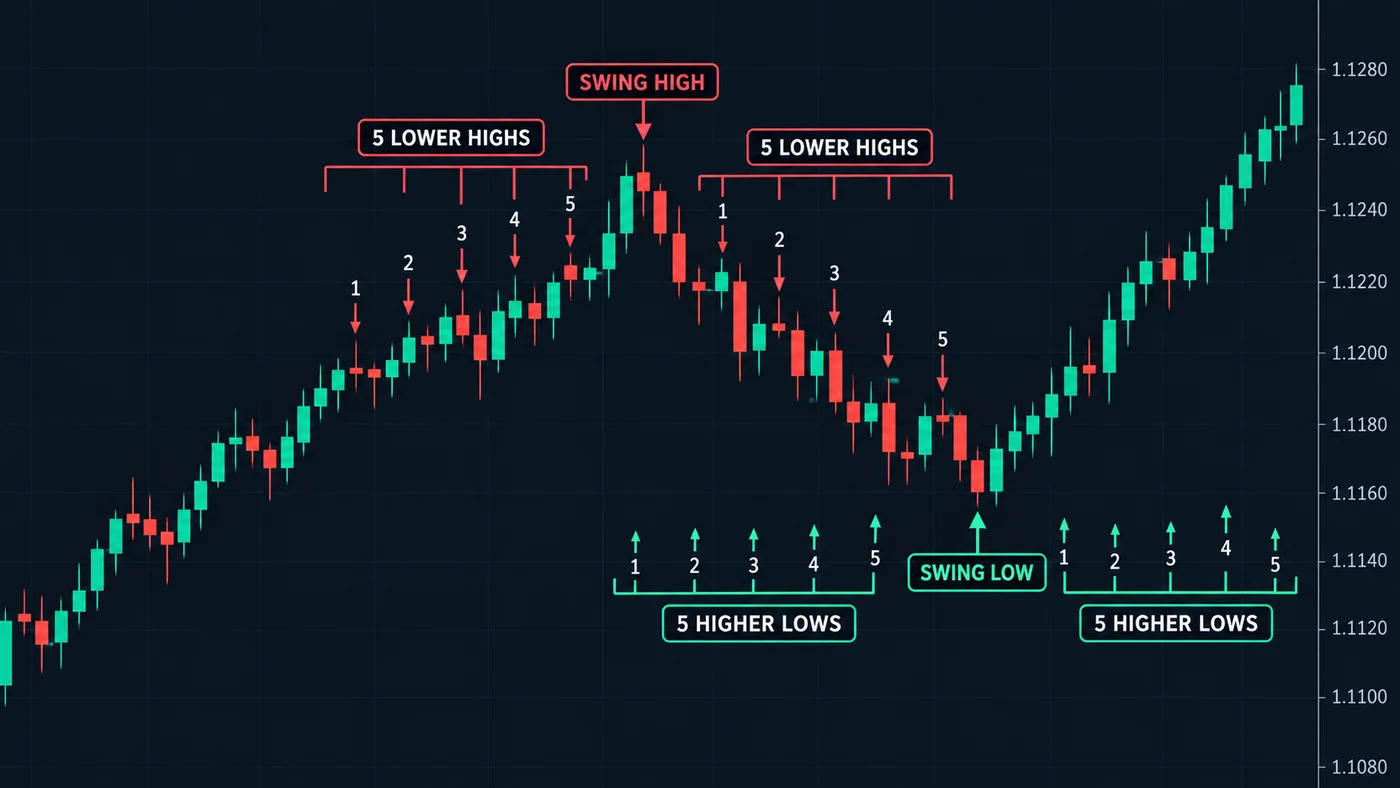
What "market structure" means
Market structure is just the shape price leaves behind as it moves. It's not a secret system. It's the path of the last few places price turned around.
Price never moves in a straight line. It goes up a bit, pulls back, goes up again. Those turns are the bones of the chart. Once you see them, you can answer the first question on any chart: which way is price going right now?
Turning points: the only marks you need
A turning point is a place where price clearly changed direction.
- A high turning point is a peak. Price rose, stopped, and turned down. Traders call it a swing high.
- A low turning point is a dip. Price fell, stopped, and turned up. Traders call it a swing low.
You'll see both names in videos and books. They mean the same thing. See swing high and swing low for the short version.
How to mark them (a simple rule)
Eyeballing turns works, but it's easy to fool yourself. A fixed rule keeps you honest. Here's one that many traders use:
- Find a candle whose high is higher than the 5 candles on each side of it. That's a high turning point.
- Find a candle whose low is lower than the 5 candles on each side of it. That's a low turning point.
- Mark only those. Ignore every small wiggle in between.
Notice one thing about this rule: you can't confirm a turning point until 5 more candles have closed after it. That delay is normal. It's the price of being sure, and it stops you from calling every small bounce a turn.
Pick one chart and one rule, and keep them. If you change the rule halfway through, you'll find whatever pattern you hoped to see.
The uptrend: higher highs and higher lows
An uptrend is not "price went up today." It has a clear shape:
- Each peak is higher than the last peak. That's a higher high.
- Each dip is higher than the last dip. That's a higher low.
Think of someone climbing stairs. They step up, rest a little, then step up again. The resting spots keep getting higher. That's the whole idea.
A described example
Say a stock does this over a few weeks:
- Rises to $50, then dips to $46.
- Rises to $54, then dips to $49.
- Rises to $57, then dips to $52.
Peaks: $50, $54, $57 — each higher. Dips: $46, $49, $52 — each higher. That's an uptrend. The number to watch is the last dip, $52. As long as price stays above it, the pattern is still in place.
The downtrend: lower highs and lower lows
A downtrend is the mirror image:
- Each peak is lower than the last peak.
- Each dip is lower than the last dip.
Now picture walking down stairs. The resting spots keep getting lower. In a downtrend, the number to watch is the last peak. While price stays under it, the pattern is still down.
The range: when there's no trend
Sometimes price just bounces between a ceiling and a floor. Peaks land at about the same price. Dips land at about the same price. That's a range.
A range isn't bad. It just means the market hasn't picked a side yet. Many traders do less here, or wait at the edges, because the middle of a range is where choices get random. The edges are support and resistance — our guide to support and resistance shows how to mark them.
| What you see | Peaks | Dips | What it means |
|---|---|---|---|
| Uptrend | Higher each time | Higher each time | Buyers are in control for now |
| Downtrend | Lower each time | Lower each time | Sellers are in control for now |
| Range | About the same | About the same | Nobody's in control yet |
When the pattern breaks
Trends end. The structure tells you when, if you know what to watch.
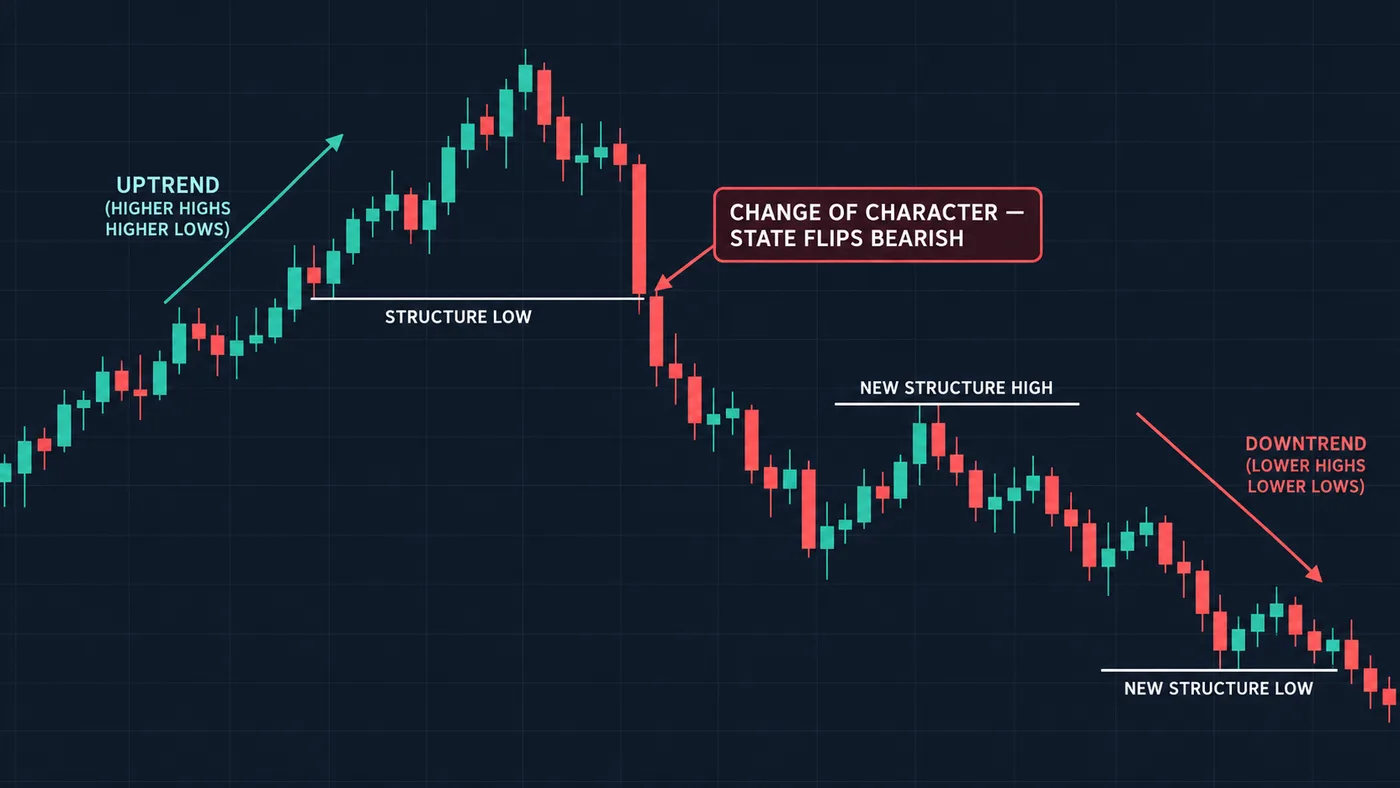
In an uptrend, the key level is the last higher low. That dip is where buyers last stepped in. If price falls below it, buyers didn't defend it. The pattern of higher lows is broken.
In a downtrend, the key level is the last lower high. If price climbs above it, sellers didn't defend it.
That same key level is also a natural place to say "I was wrong." Many traders put their stop loss just past it, then size the trade with a position size calculator. More in how to set a stop loss.
You'll hear two names for these moments:
- A break of structure usually means price pushed past a turning point in the same direction as the trend — a new higher high in an uptrend. The trend continues.
- A change of character usually means price broke the key level against the trend — below the last higher low in an uptrend. It's the first warning that the trend may be turning.
The BOS vs CHoCH comparison goes deeper on the two.
The body-close rule (the one that saves you)
Here's the most important habit on this page. A break only counts when a candle body closes past the level. A wick poking through doesn't count.
Why? A wick shows price visited that area and got pushed back. The close shows where price settled when the candle finished. Price often stabs just past an obvious level and snaps right back. If you act on the stab, you act on a trap.
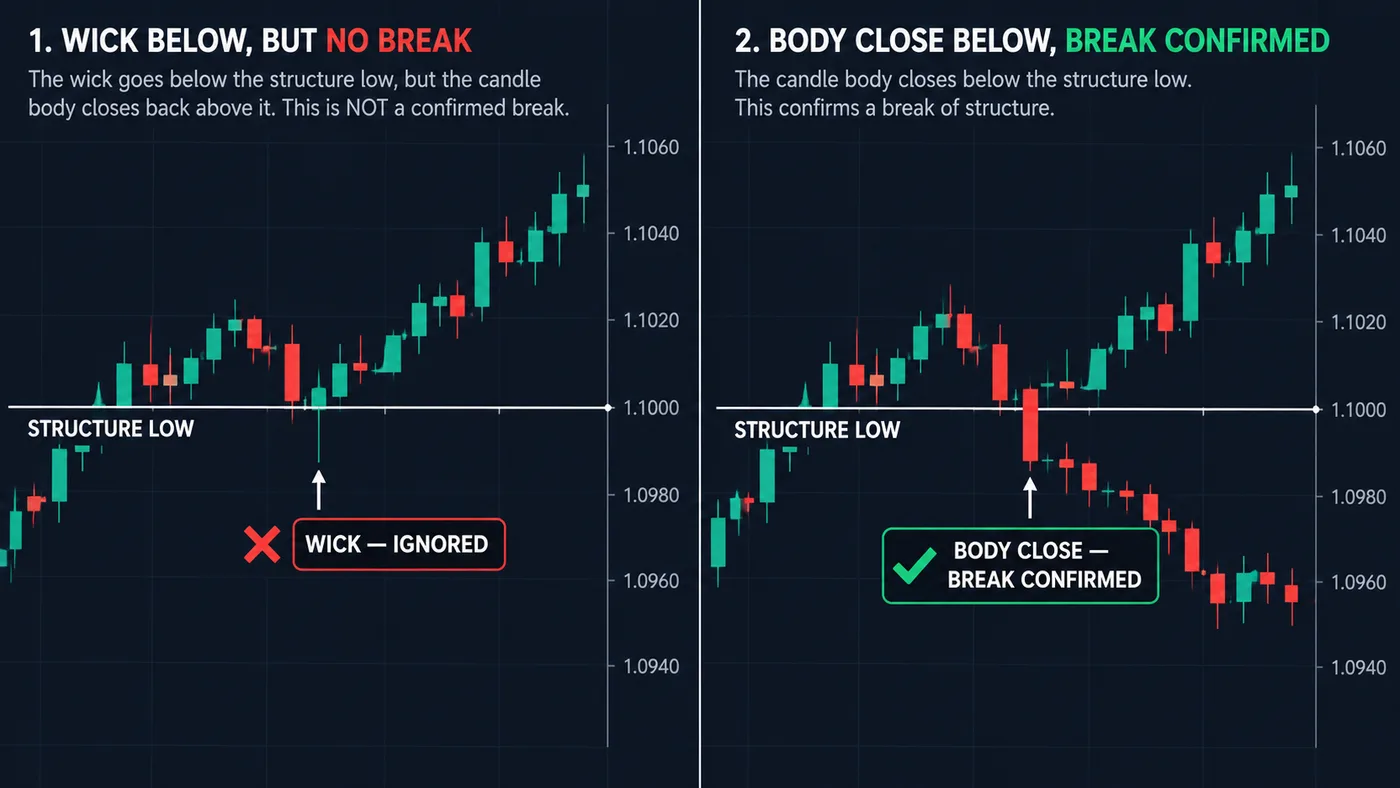
So the test is simple:
- Is there a key level? (Last higher low in an uptrend, last lower high in a downtrend.)
- Did a candle body close past it?
- If only a wick went through, the structure is still intact. Wait.
The breakout vs fakeout guide shows this test on real-looking setups.
Check the bigger chart first
The same chart can be in an uptrend on the daily view and a downtrend on the 15-minute view. Both are true at once. That's why we start big:
- Read the structure on a bigger chart (daily or 4-hour) to get the main direction.
- Drop to a smaller chart to find a spot to act.
- Look for trades that go with the bigger direction.
The multiple timeframe analysis guide walks through this step by step.
Common beginner mistakes
- Marking every wiggle. Too many turning points and every candle looks like a signal. Use a fixed rule.
- Calling a trend after one higher high. You need the full pattern: peaks and dips both stepping up.
- Trusting wicks. A wick past the level is a visit, not a break.
- Forgetting the bigger chart. A small downtrend inside a big uptrend is often just a pullback.
- Expecting certainty. Structure tells you who's in control right now. It doesn't predict. Trends can break at any time, and trades can lose.
Marking turning points by hand is great practice. Once you know how, our free chart tool can mark them for you on TradingView, including in the phone app — add it here.
Try it today
- Open any daily chart. Our TradingView guide helps if it's new to you.
- Mark the last 4 high turning points and the last 4 low turning points.
- Label it: uptrend, downtrend, or range.
- Write down the one level that would break it.
- Check back in a week. Did a body close past your level, or not?
Questions
What is a higher high and higher low?
A higher high is a peak above the last peak. A higher low is a dip above the last dip. When both keep happening, price is in an uptrend.
How do you know when an uptrend is over?
Watch the last higher low. If a candle body closes below it, buyers failed to defend it and the uptrend pattern is broken. A wick below it on its own doesn't count.
Does market structure work on every timeframe?
Yes, the pattern is the same on a 5-minute chart and a weekly chart. Bigger charts carry more weight, so read them first and use smaller ones to fine-tune.
Is market structure the same as support and resistance?
They're related. Turning points often become support and resistance levels. Structure adds the order of those points, which tells you the direction.
Can market structure predict where price will go?
No. It shows who has been in control so far. That helps you choose a side and a place to be wrong, but any trade can still lose.
Want the next step? We'll walk you through it.
Four free lessons by email, one every few days — each with a 10-minute exercise on a real chart.
Send Me the Free Lessons 4 short emails · No spam · Unsubscribe anytimeOr see the whole method, step by step:
See What’s Inside the Course Try everything free first. Decide when you're ready. · Open the free chart tool (works in the TradingView phone app)One chart idea a day, in plain English. Follow along: