
What is support in trading?
In one line: Support is a price area where a falling market has stopped and turned back up before, because buyers stepped in there.
A simple example
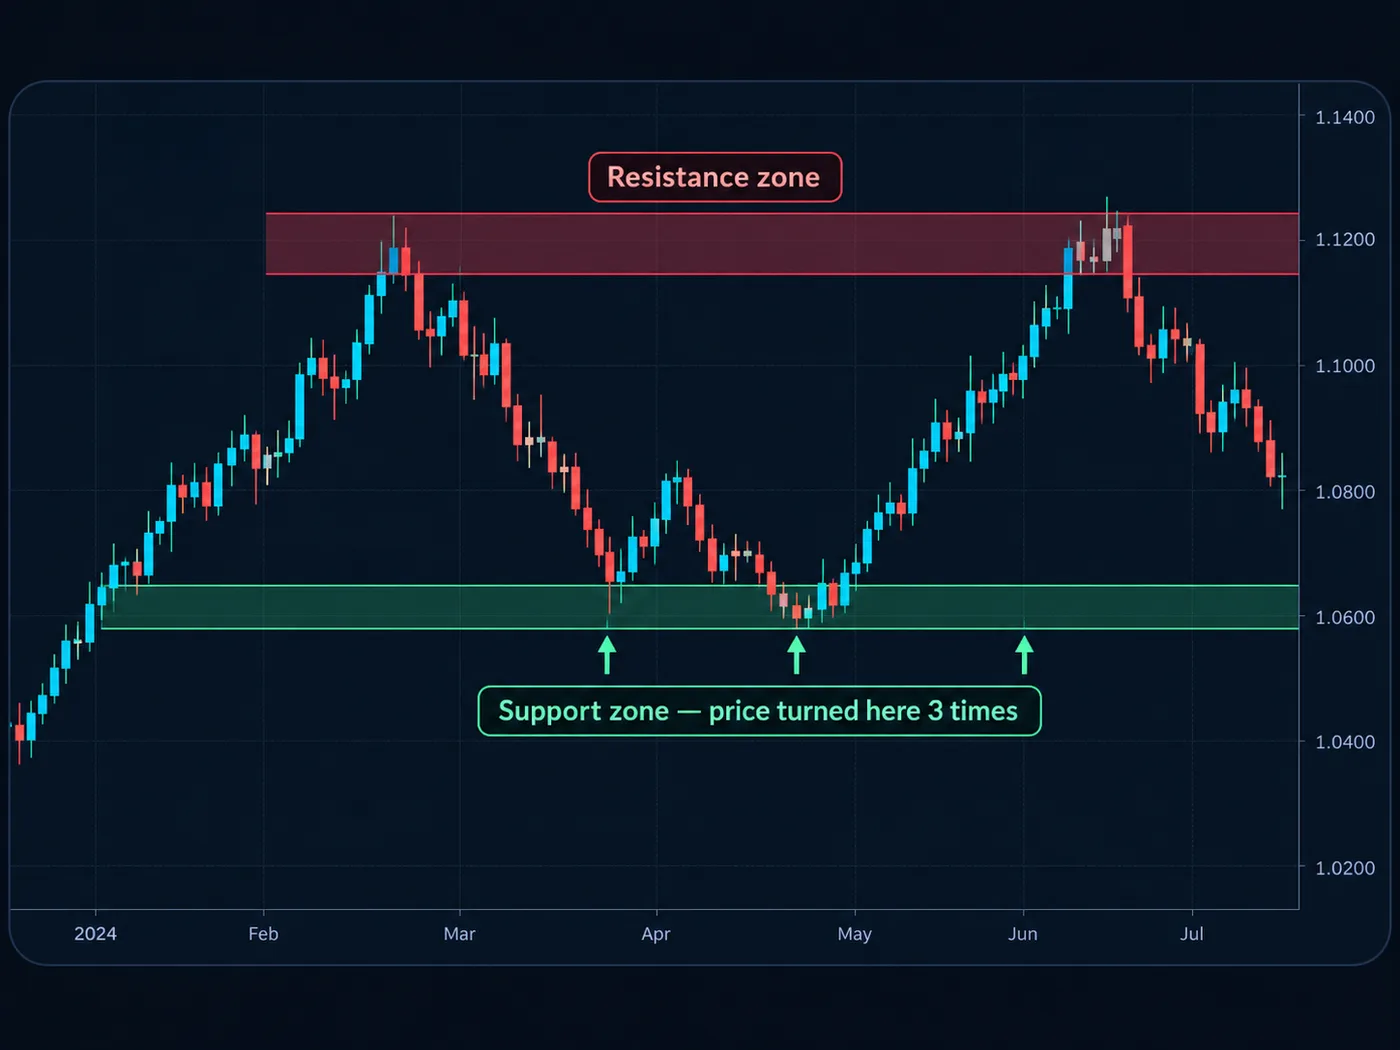
Picture a daily chart of a stock. In March it falls to about $30 and bounces. In June it drops to $30.20 and bounces again. In August it dips to $29.85 and turns up once more.
That area, roughly $29.80 to $30.30, is support. Three times, buyers decided that was cheap enough. The next time price falls toward $30, many traders will be watching it.
Why it matters
Support gives you a place to make a decision instead of guessing in the middle of the chart. If you're thinking of buying, a pullback to support is a clearer spot than halfway up a move. It also gives you a natural Stop loss spot: just below the zone, where the idea is proven wrong.
What happens when support breaks
If a candle body closes clearly below support, the floor has given way. Something useful often happens next. The old floor can turn into a ceiling, a new Resistance. Price drops through $30, bounces back up to $30, and sellers push it down from there.
A Wick dipping below and snapping back is different. That's a test, not a break.
A common mistake
Drawing support as one exact line. Price rarely turns at the same cent twice. If you expect $30.00 exactly, you'll call every dip to $29.85 a "break." Draw a small zone around the turns instead.
The second mistake is marking too many levels. Three or four zones on a chart are plenty. The full method is in support and resistance explained simply.
Questions
How do you find support levels?
Zoom out to a daily chart and look for places where price turned up more than once. Shade the small area around those turns.
Does support get stronger or weaker each time it's tested?
Both ideas are true. More turns make a level more visible, but each test can use up the buyers there. Watch how strongly price bounces.
Is support the same as a demand zone?
They overlap. Support marks where price turned; a Supply and demand zone marks the area a strong move started from.
Want the next step? We'll walk you through it.
Four free lessons by email, one every few days — each with a 10-minute exercise on a real chart.
Send Me the Free Lessons 4 short emails · No spam · Unsubscribe anytimeOr see the whole method, step by step:
See What’s Inside the Course Try everything free first. Decide when you're ready. · Open the free chart tool (works in the TradingView phone app)One chart idea a day, in plain English. Follow along: