
Home › Guides › Reading charts
Support and resistance: how to find a chart's floors and ceilings
Price has a memory. Where it turned before, it often reacts again. Those spots are support and resistance, and they're the first thing worth marking.
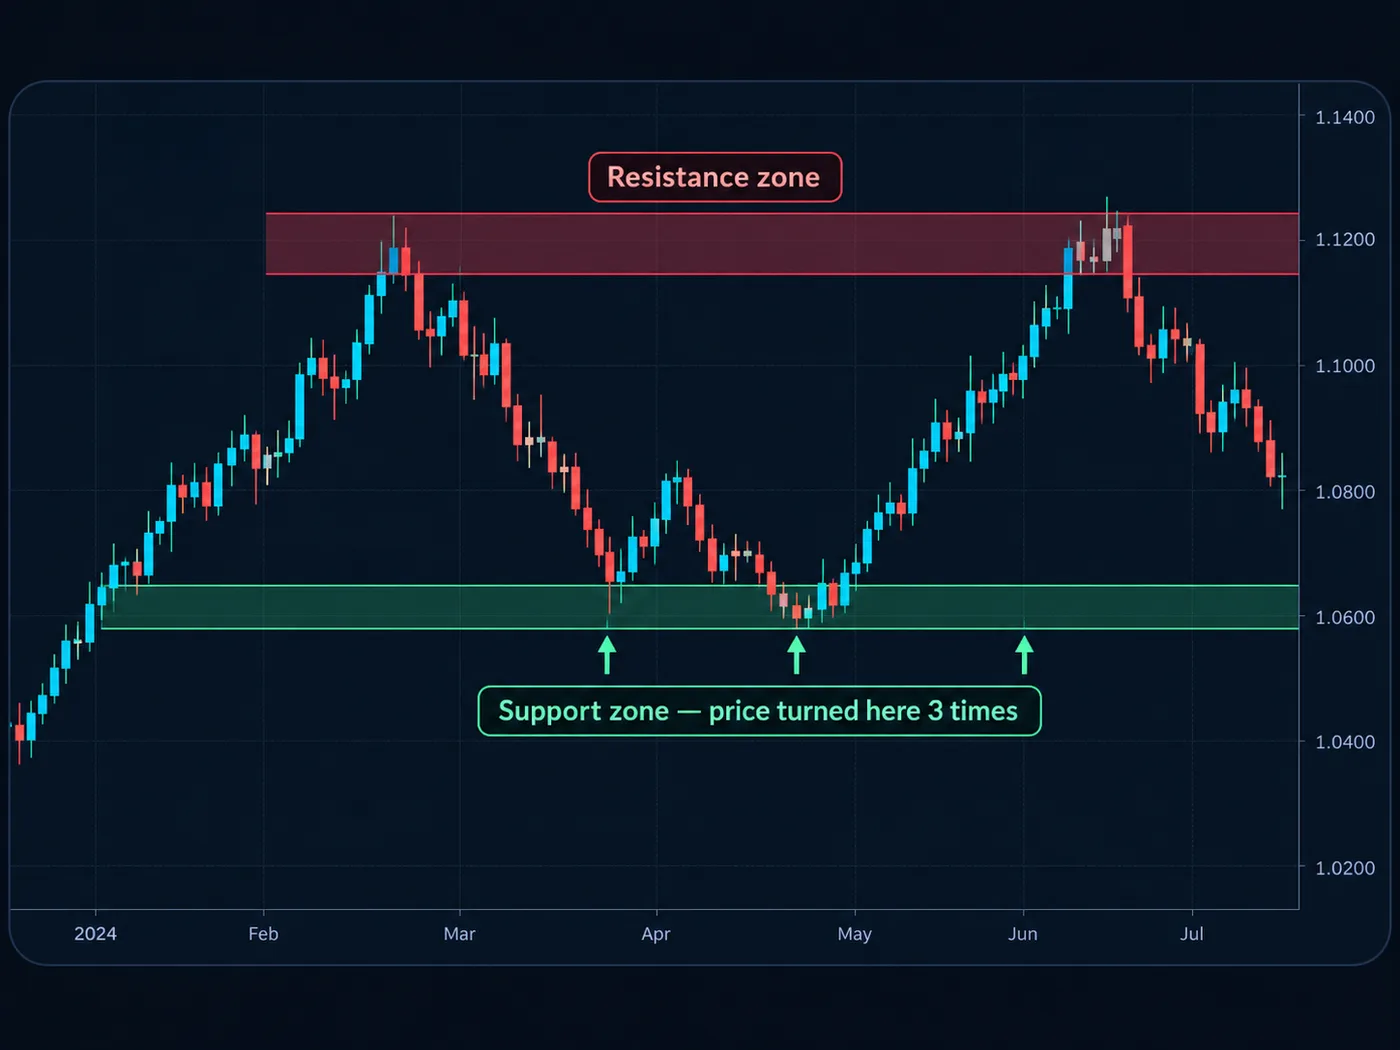
Support: a floor
Support is an area where price stopped falling and turned back up. Buyers stepped in there before. When price comes back down to it, buyers often show up again.
Resistance: a ceiling
Resistance is an area where price stopped rising and turned back down. Sellers stepped in there before, and they often do again.
How to find them in three steps
- Zoom out. Use a daily chart first. The bigger the time frame, the more a level matters.
- Look for the turns. Find places where price clearly turned around — the more times, the stronger the zone.
- Draw a zone, not a line. Shade the small area around the turns. A level is a neighborhood, not an address.
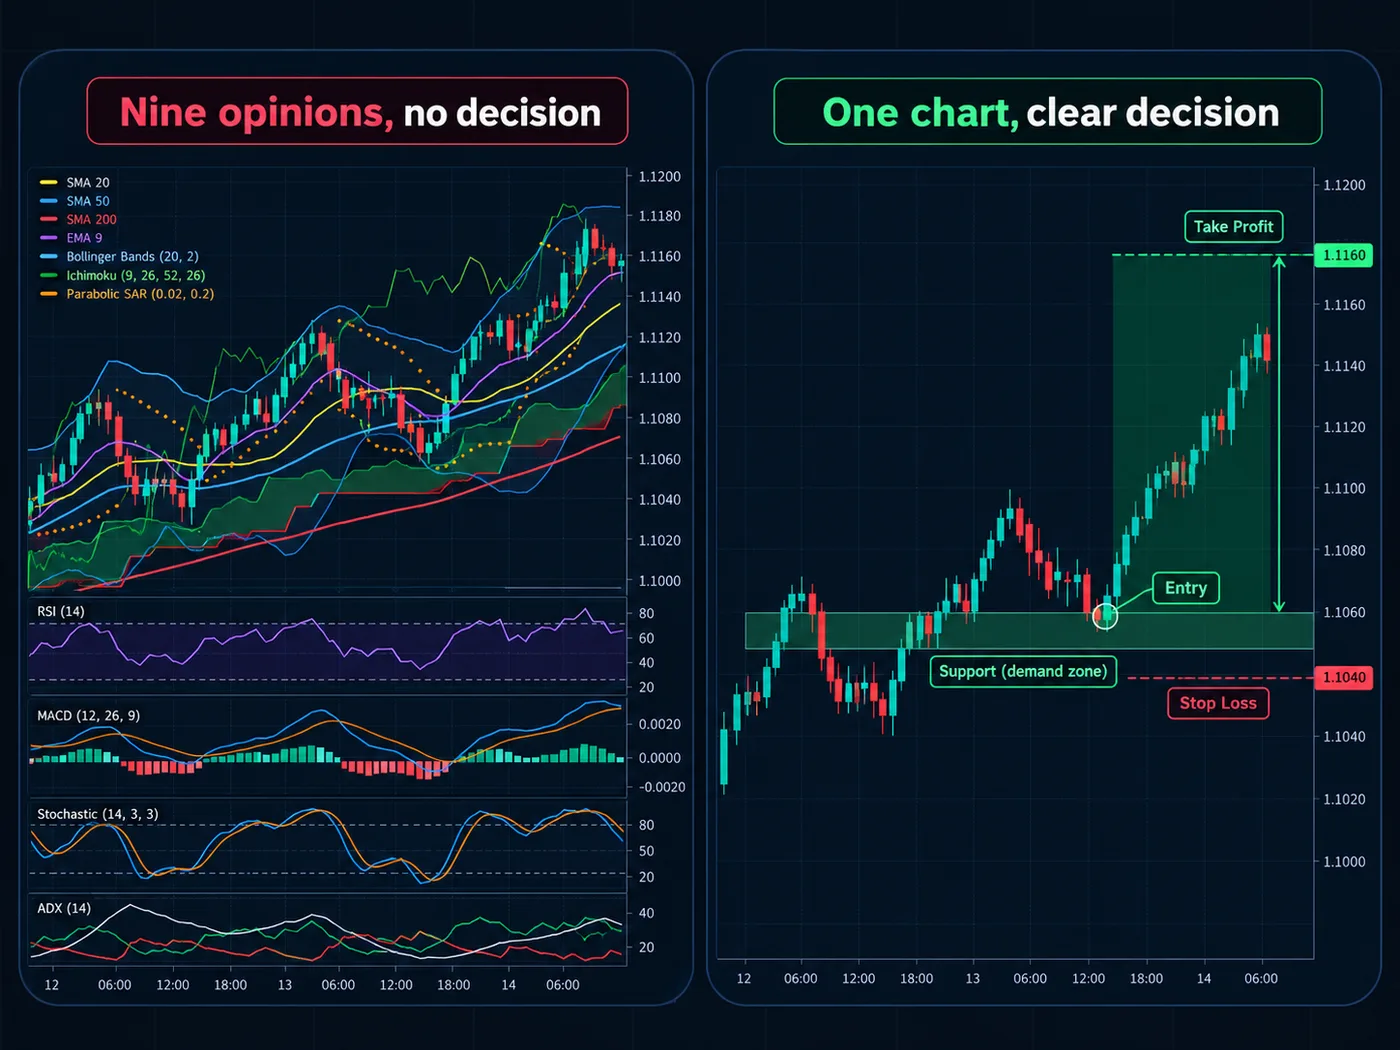
Keep it clean. Three or four zones are plenty. A chart covered in lines tells you nothing, because everything looks important.
What happens when a level breaks
Levels don't hold forever. When one breaks, use the same test as always: did a candle body close past it, or just a wick? A wick poking through is often a trap. A clear body close is a real break.
Something useful often happens next: an old ceiling can become a new floor, and an old floor can become a new ceiling. Price breaks above resistance, comes back down to it — and buyers defend it from above.
Common beginner mistakes
- Too many lines. If everything is a level, nothing is.
- Exact-price thinking. Expecting price to turn at one perfect number.
- Trading the middle. The best decisions happen at the zones, not halfway between them.
Our free chart tool marks the latest turning points for you automatically, so your chart stays clean. Add it on TradingView.
Questions
How many times does price need to touch a level for it to count?
Two clear turns make a level worth marking; three or more make it stronger. But a level can also weaken each time it's tested, because the buyers or sellers there get used up.
Is support and resistance the same as supply and demand?
They're close cousins. Support and resistance marks where price turned; supply and demand zones mark the area a strong move started from. See support/resistance vs supply/demand.
Which timeframe gives the best levels?
Levels from the daily and weekly charts matter most, because more traders see them. Use shorter charts to fine-tune, not to find the main levels.
Want the next step? We'll walk you through it.
Four free lessons by email, one every few days — each with a 10-minute exercise on a real chart.
Send Me the Free Lessons 4 short emails · No spam · Unsubscribe anytimeOr see the whole method, step by step:
See What’s Inside the Course Try everything free first. Decide when you're ready. · Open the free chart tool (works in the TradingView phone app)One chart idea a day, in plain English. Follow along: