
Support and resistance vs supply and demand: close cousins
Support and resistance marks where price turned around. Supply and demand marks where a strong move began, and on a clean chart they often land in the same place.
The short answer
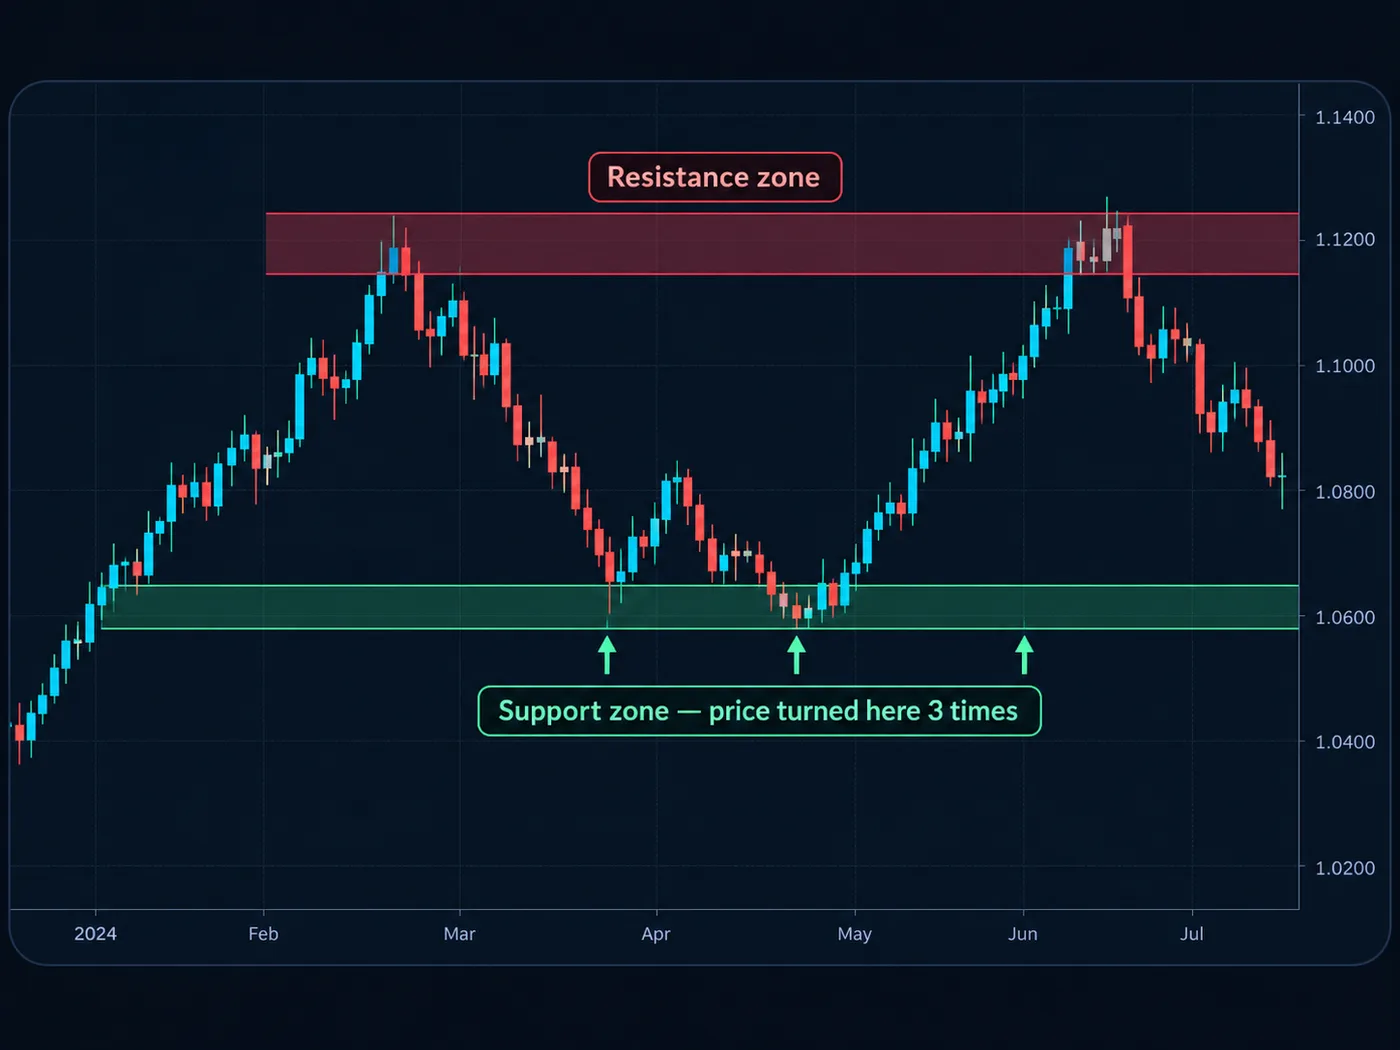
Support is a floor where price stopped falling and turned up. Resistance is a ceiling where price stopped rising and turned down. You find them by looking for repeated turns.
A Supply and demand zone is the small area a strong, fast move started from. You find it by looking for the jump, then marking where it began.
Same goal, different clue. Support and resistance looks at how often price turned. Supply and demand looks at how hard it left.
Side by side
| Support and resistance | Supply and demand zones | |
|---|---|---|
| What you look for | Places price turned around before | The base a strong, fast move left from |
| Main clue | Number of turns | Strength of the move away |
| Drawn as | A zone across several turns | A box around the starting area |
| Gets stronger when | Price turns there again | The move away was fast and big |
| Gets weaker when | It's tested many times | Price comes back to it again and again |
| After a break | Old ceiling can become new floor | The zone is usually treated as used up |
| Easiest for beginners? | Yes, very easy to see | Takes a bit more practice |
Support and resistance: where price turned
Zoom out to the daily chart. Find places where price clearly turned around two or three times. Shade a small zone around those turns. That's it.
The good parts:
- Easy to see. Many traders watch the same obvious levels.
- Works on any chart. Stocks, forex, futures, crypto.
- Flips are useful. When a ceiling breaks, it often becomes a floor.
The hard parts:
- Too many lines. Mark everything and nothing stands out.
- Breaks happen. A body close through the zone means it didn't hold.
More in support and resistance.
Supply and demand: where a strong move began
Look for a big, fast move: several large candles in a row. Go back to the quiet spot right before it. Shade that area. If price returns, it's a place to watch.
The good parts:
- Spots fresh levels. You don't need several touches first.
- Shows strength. A fast move away hints that big orders were there.
The hard parts:
- Easy to over-mark. Every small pause can look like a zone.
- One-time use. Many traders only trust a zone the first time price returns.
More in supply and demand zones.
Where they overlap
Often, a strong move starts at a place price already turned before. So a demand zone may sit right on top of a support zone. When both clues point to the same spot, many traders treat it as a stronger area to watch.
One clean chart. Mark three or four support and resistance zones on the daily chart. Then, if a fresh supply or demand zone sits near one, note it. Leave the rest off.
Our free chart tool on TradingView marks the latest turning points for you, which makes both kinds of level easier to find. Add it here.
Which fits you?
- Just starting? Begin with support and resistance. It's the easiest skill to build first.
- Want fresher levels? Add supply and demand once spotting turns feels easy.
- Want proof for yourself? Mark both on 20 past charts and log which ones price respected. See how to backtest a trading strategy.
Either way, a level is a place to watch, not a reason to trade by itself. Check the trend and set your stop first.
Common mistakes
- Exact-price thinking. Both are zones. Price rarely turns at one perfect number.
- Trading the middle. Decisions belong at the zones, not between them.
- Counting wicks as breaks. Only a candle body closing past a zone counts.
- Never removing old levels. Clear the chart when a zone has clearly broken.
Questions
Is supply and demand the same as support and resistance?
They're close cousins. Support and resistance marks where price turned, often more than once. Supply and demand marks where a strong move began. They often sit in the same place.
Which is more reliable, support and resistance or supply and demand?
Neither works every time. Many traders find levels strongest where both line up, especially on the daily chart. Test both on past charts and see what you trust.
Can support become resistance?
Yes. When price breaks below a support zone with a body close, that old floor often acts as a ceiling when price comes back up to it.
How many zones should I draw?
Three or four on your main chart is plenty. A chart covered in boxes makes everything look important, so nothing is.
Want the next step? We'll walk you through it.
Four free lessons by email, one every few days — each with a 10-minute exercise on a real chart.
Send Me the Free Lessons 4 short emails · No spam · Unsubscribe anytimeOr see the whole method, step by step:
See What’s Inside the Course Try everything free first. Decide when you're ready. · Open the free chart tool (works in the TradingView phone app)One chart idea a day, in plain English. Follow along: