
Home › Guides › Reading charts
Breakout or fakeout? 3 checks to tell them apart
Price pushes past a level. Is the move starting, or about to snap back? 3 simple checks help you tell before you act.
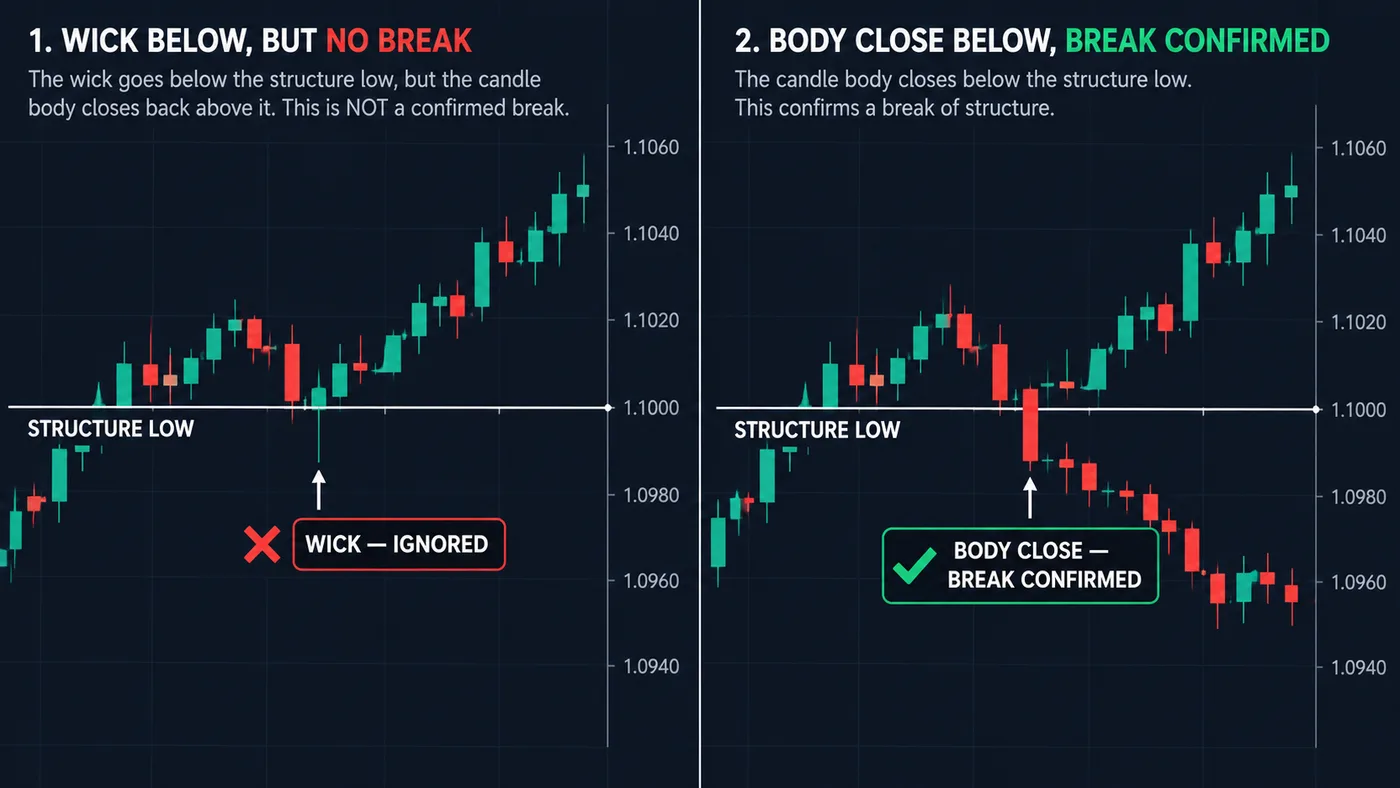
Breakout and fakeout, defined
- A breakout is when price moves past an important level and keeps going.
- A fakeout is when price moves past that level, then quickly comes back inside. It looked like a break. It wasn't.
Fakeouts happen a lot at obvious levels. Many traders place orders just past the same lines, so price often reaches past them, triggers those orders, and turns around. That's why waiting for proof matters.
Check 1: did a body close past the level?
This is the most important check. Only a candle body closing past the level counts. A wick poking through doesn't.
- The wick shows where price visited during the candle.
- The body close shows where price settled when the candle finished.
If a candle stabs above resistance and then closes back below it, buyers couldn't hold the higher price. That's the classic fakeout shape: a long wick through the level, a body that stayed inside.
Wait for the close. A candle can look like a breakout for 50 minutes of an hour and still close back inside. Judge it when its time is up, not before.
Check 2: did the retest hold?
After a real break, price often comes back to test the level it just broke. This is the retest.
- Break above a ceiling: price comes back down to the old ceiling. If it holds and bounces, the old ceiling is acting as a new floor. Good sign.
- Break below a floor: price comes back up to the old floor. If it gets rejected there, the old floor is acting as a new ceiling.
If price slices right back through the level on a body close, the break has failed.
Not every breakout retests. Some just run. Waiting for a retest means you'll miss some moves — and skip many traps. That's a trade-off many traders are happy to make.
Check 3: does the bigger chart agree?
A break that goes with the bigger chart's direction tends to have more behind it than one that goes against it.
- Look one chart bigger than the one you're watching.
- Is it in an uptrend, a downtrend, or a range? Use how to identify a trend.
- A break up in a bigger uptrend is going with the flow. A break up in a bigger downtrend is swimming upstream, and fails more often.
More on reading two charts at once in multiple timeframe analysis.
The three checks side by side
| Check | Real breakout | Likely fakeout |
|---|---|---|
| The close | Body closes clearly past the level | Only a wick gets past; body closes back inside |
| The retest | Old level holds from the other side | Price slices back through on a body close |
| Bigger chart | Break goes with its direction | Break goes against it |
No single check is perfect. When all three line up, the picture is clearer. When they disagree, many traders simply wait.
A described example
An illustration, not a real trade. A stock has topped out near $25.00 three times. The daily chart is in an uptrend.
- Monday: price jumps to $25.40 during the day but closes at $24.85. Just a wick above. Not a break.
- Wednesday: a candle closes at $25.30 — a body close above $25.00. That's check 1.
- Friday: price dips back to $25.05, holds, and closes at $25.45. The retest held. That's check 2.
- The daily trend is up. That's check 3.
Even with all three checks, the trade can still fail. That's why the stop loss goes where the idea is wrong — here, back below $25.00 — and the size comes from the position size calculator.
Fakeouts as information
A fakeout isn't just something to avoid. It tells you something.
When price stabs above a ceiling and closes back below, the buyers who chased the break are now stuck. If price keeps falling, they may sell to get out, which can push price lower. Some traders watch for exactly this. It's called a liquidity sweep — see liquidity sweeps explained.
The same body-close rule decides what a turning point break means for the trend, too. The full story is in higher highs and higher lows.
Common beginner mistakes
- Buying the first poke. Acting on the wick before the candle closes.
- Using tiny charts. On a 1-minute chart, levels "break" every few minutes.
- Breaking levels nobody cares about. A break of a big daily level means more than a break of a line you drew on the 2-minute.
- Moving the stop after a fakeout. If the break fails, the idea failed. Take the small loss and reset.
Try it today
- Find a level on a daily chart that price has touched at least twice.
- Scroll back through past breaks of similar levels.
- For each, note: body close or wick? Retest held or not? Bigger chart agreed or not?
- Count how many "wick only" breaks turned into fakeouts.
You'll see the pattern quickly. Using TradingView bar replay to hide the future while you judge makes the exercise honest.
Questions
How do you know if a breakout is real?
Look for a candle body closing past the level, a retest that holds from the other side, and a bigger chart pointing the same way. All three together make a clearer case.
What is a fakeout in trading?
A fakeout is when price moves past a level, then quickly comes back inside it. It often shows up as a long wick through the level with the body closing back on the original side.
Should I always wait for a retest?
Waiting for a retest skips many traps but also misses some moves that never come back. Many beginners prefer to wait, because missing a move costs nothing.
Why do fakeouts happen so often?
Obvious levels collect a lot of orders just past them. Price often reaches those orders, fills them, and turns back once they're used up.
Want the next step? We'll walk you through it.
Four free lessons by email, one every few days — each with a 10-minute exercise on a real chart.
Send Me the Free Lessons 4 short emails · No spam · Unsubscribe anytimeOr see the whole method, step by step:
See What’s Inside the Course Try everything free first. Decide when you're ready. · Open the free chart tool (works in the TradingView phone app)One chart idea a day, in plain English. Follow along: