
What is a breakout in trading?
In one line: A breakout is when price moves through a support or resistance level and stays beyond it, instead of turning back.
A simple example
A stock turned down near $25.00 three times last month. That area is resistance — a ceiling.
Today a candle pushes up and closes at $25.60, with its body fully above the ceiling. That's a breakout. The ceiling that held three times has given way.
Often, the old ceiling then acts like a floor. Price may come back down to about $25.00, hold, and move on. Many traders wait for that retest instead of buying the first push.
The body-close test
In our method, only a candle body closing past the level counts. A thin line (a wick) poking through and snapping back doesn't.
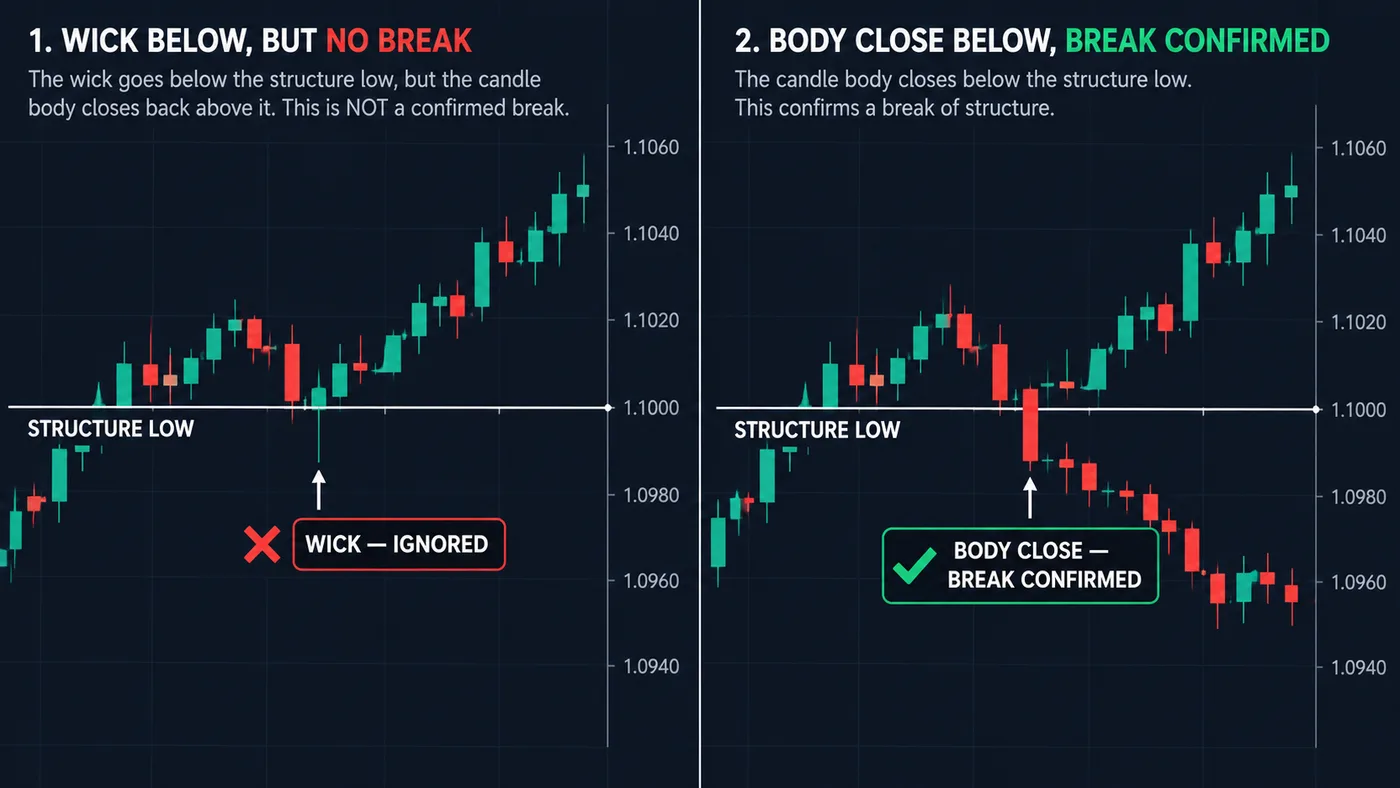
Why so strict? Because the poke-and-snap-back is exactly what a fakeout looks like while it's happening. Waiting for the close costs a little price, but it filters out many false starts. It won't filter them all.
Why it matters
Breakouts are where a market often changes gear. A range that went nowhere for weeks can start a new trend after one. That's why so many traders watch the same levels — and why the move through them can be fast.
A common mistake
Buying the very first tick through the level. Price touches $25.01, excitement kicks in, and the order goes in before the candle has even closed. If the candle then closes back below $25.00, the "breakout" was never real.
Before you trade a breakout, ask: where is my stop loss if this fails? If the answer is "far away," the trade gets smaller. Check it with the risk-reward calculator.
The full side-by-side is in breakout vs fakeout.
Questions
How do you confirm a breakout?
Wait for a candle body to close beyond the level. Some traders also look for higher volume or a retest that holds. None of these make it certain.
Do breakouts work on all timeframes?
The idea is the same on every chart, but a break on a daily chart usually matters more than one on a 1-minute chart.
What happens after a failed breakout?
Price often moves back into the old range, sometimes fast, because traders who bought the break get out.
Want the next step? We'll walk you through it.
Four free lessons by email, one every few days — each with a 10-minute exercise on a real chart.
Send Me the Free Lessons 4 short emails · No spam · Unsubscribe anytimeOr see the whole method, step by step:
See What’s Inside the Course Try everything free first. Decide when you're ready. · Open the free chart tool (works in the TradingView phone app)One chart idea a day, in plain English. Follow along: