
How to read stock charts in 5 steps
A stock chart is a picture of where buyers and sellers agreed on a price. Read it in the same 5 steps every time, and it stops looking like noise.
Step 1: Price and time
Every stock chart has two directions:
- Up and down is price. Higher on the chart means a higher price.
- Left to right is time. The newest price is on the far right.
Each bar or candle covers one slice of time. On a daily chart, each candle is one trading day. On a 5-minute chart, each candle is five minutes. That slice is called the Timeframe.
US stocks trade from 9:30 am to 4:00 pm ET, so a daily candle covers that session.
Step 2: Read the candles
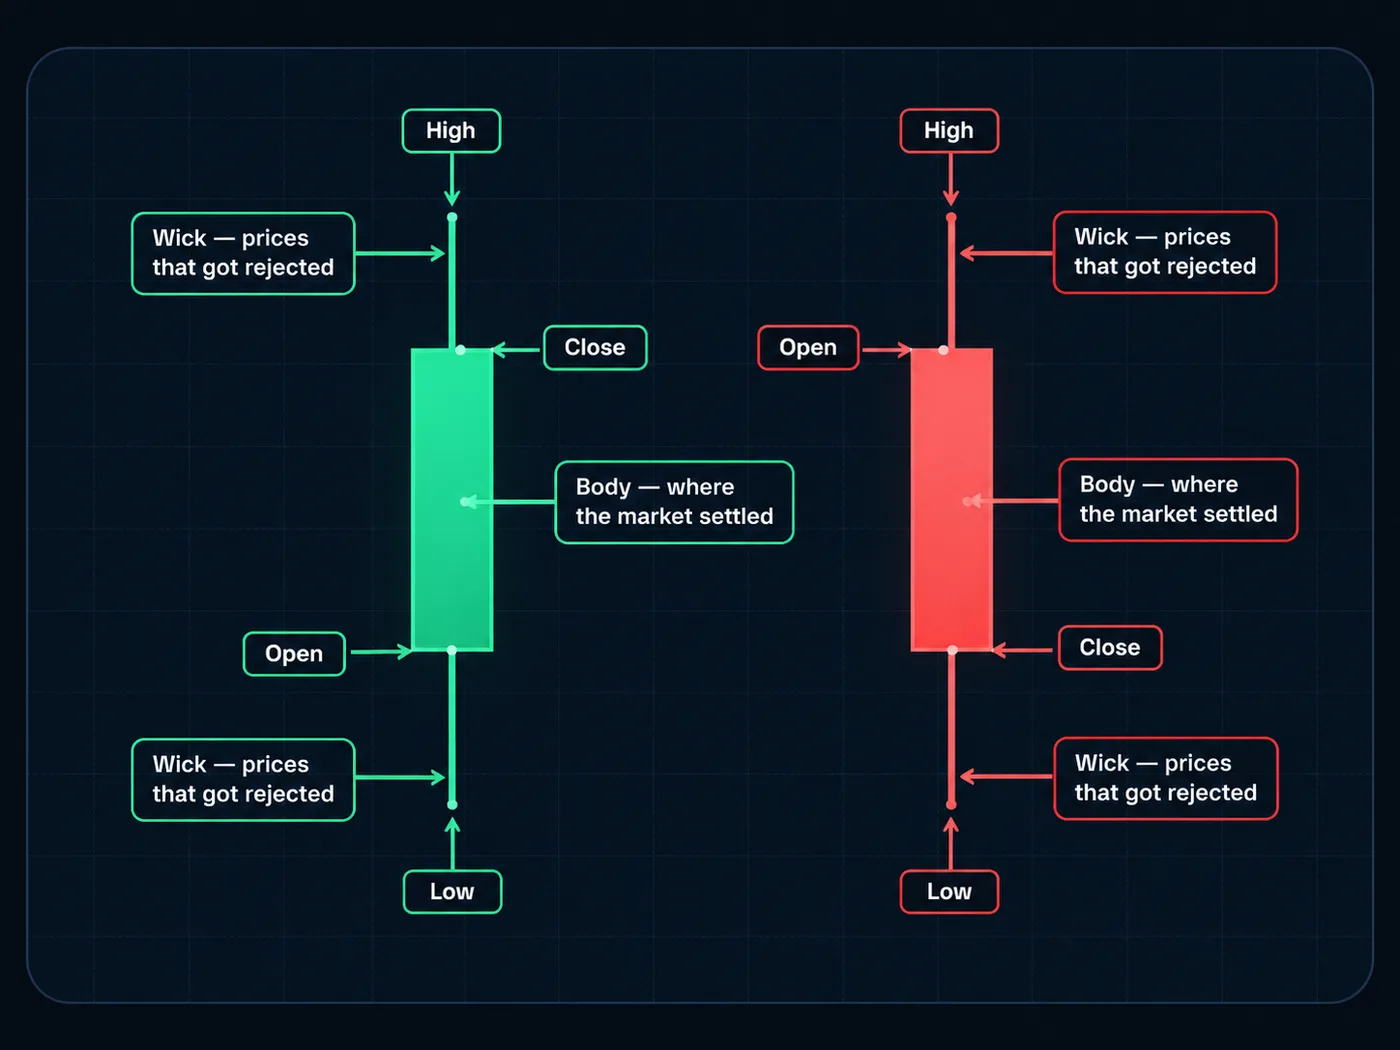
Most traders use candlestick charts. Each Candlestick shows four prices:
- Open: the price when the candle started.
- Close: the price when it ended.
- High: the highest price in that time.
- Low: the lowest price in that time.
The thick part is the body — from open to close. The thin lines are wicks — how far price stretched before pulling back.
If the close is higher than the open, the candle is usually green (price went up). If the close is lower, it's usually red. The full guide is how to read a candlestick chart.
Bodies matter more than wicks. A body shows where price settled. A wick shows where it only visited. When you test whether a level broke, look for a body close past it.
Step 3: Find the trend
Zoom out to a daily chart and look at the last few places price turned around.
- Uptrend: higher highs and higher lows. Each push up goes higher, and each dip stops higher.
- Downtrend: lower highs and lower lows.
- Sideways: price bouncing between a floor and a ceiling.
That's all a Trend is. You don't need a special tool to see it — just mark the turns. See how to identify a trend and higher highs and higher lows.
Step 4: Mark support and resistance
Places where price turned around before often matter again.
- Support is a floor: price stopped falling there and turned up.
- Resistance is a ceiling: price stopped rising there and turned down.
Draw them as small zones, not thin lines. Three or four on a chart is plenty. More in support and resistance.
Step 5: Check the volume
Under most stock charts are small bars. That's Volume — how many shares changed hands in each candle.
- A move on high volume means many people took part.
- A move on low volume means fewer did.
You don't need to study volume deeply at first. Just notice when a big move comes with a big volume bar. That often marks something worth paying attention to.
Gaps: a stock-chart special
Stocks close every afternoon and reopen the next morning. News can come out in between. When the next day opens far from the last close, you see a jump on the chart with empty space. That's a Gap.
Gaps are normal in stocks, especially after earnings reports. They're one reason to check the earnings date on any stock you watch.
Check more than one timeframe
A 5-minute chart and a daily chart of the same stock can look like they disagree. They're both right — they're just showing different slices of time.
The habit: check the bigger chart first. Read the weekly or daily for direction, then use a shorter chart for detail. See multiple timeframe analysis.
A five-minute chart-reading routine
Use the same order on every stock:
- Daily chart. Up, down or sideways?
- Mark the turns. The last two or three places price turned around.
- Draw zones. Where are the nearest floor and ceiling?
- Find price. Is it near a zone, or in the middle?
- Write one sentence. "Uptrend, price pulling back toward support." That sentence is your read.
If you can't write the sentence, the chart isn't clear. That's useful too — it means wait.
Common beginner mistakes
- Starting on a tiny timeframe. A 1-minute chart is mostly noise. Start on the daily.
- Too many indicators. A chart covered in lines makes everything look important. Start with plain candles.
- Trusting one candle. One big candle is a hint, not a trend.
- Treating wicks as breaks. Wait for a body close.
Make it easier
Free charting sites like TradingView let you open any stock chart and switch timeframes in one click. See how to use TradingView. Our free StructureX chart tool there marks the last places price turned around automatically, so steps 3 and 4 get faster. Add it on TradingView.
Try it today
- Open a daily chart of a stock you know.
- Mark the last three places price turned around.
- Write your one-sentence read.
- Come back in a week and see what happened next — not to score yourself, but to learn.
Questions
What is the easiest way to read stock charts?
Use the same order every time: check price and time, read the candles, find the trend, mark support and resistance, then glance at volume. Start on the daily chart.
What do green and red candles mean?
A green candle usually means price closed higher than it opened. A red candle means it closed lower. Colors can be changed in the chart settings.
What timeframe should beginners use?
The daily chart is a good place to start. It shows the big picture with less noise. Use shorter charts later, for detail.
What does volume tell you on a stock chart?
Volume shows how many shares traded in each candle. A move on high volume had more people behind it than a move on low volume.
Want the next step? We'll walk you through it.
Four free lessons by email, one every few days — each with a 10-minute exercise on a real chart.
Send Me the Free Lessons 4 short emails · No spam · Unsubscribe anytimeOr see the whole method, step by step:
See What’s Inside the Course Try everything free first. Decide when you're ready. · Open the free chart tool (works in the TradingView phone app)One chart idea a day, in plain English. Follow along: