
What is a candlestick in trading?
In one line: A candlestick is one bar on a price chart that shows four prices for a set time: where price opened, its high, its low, and where it closed.
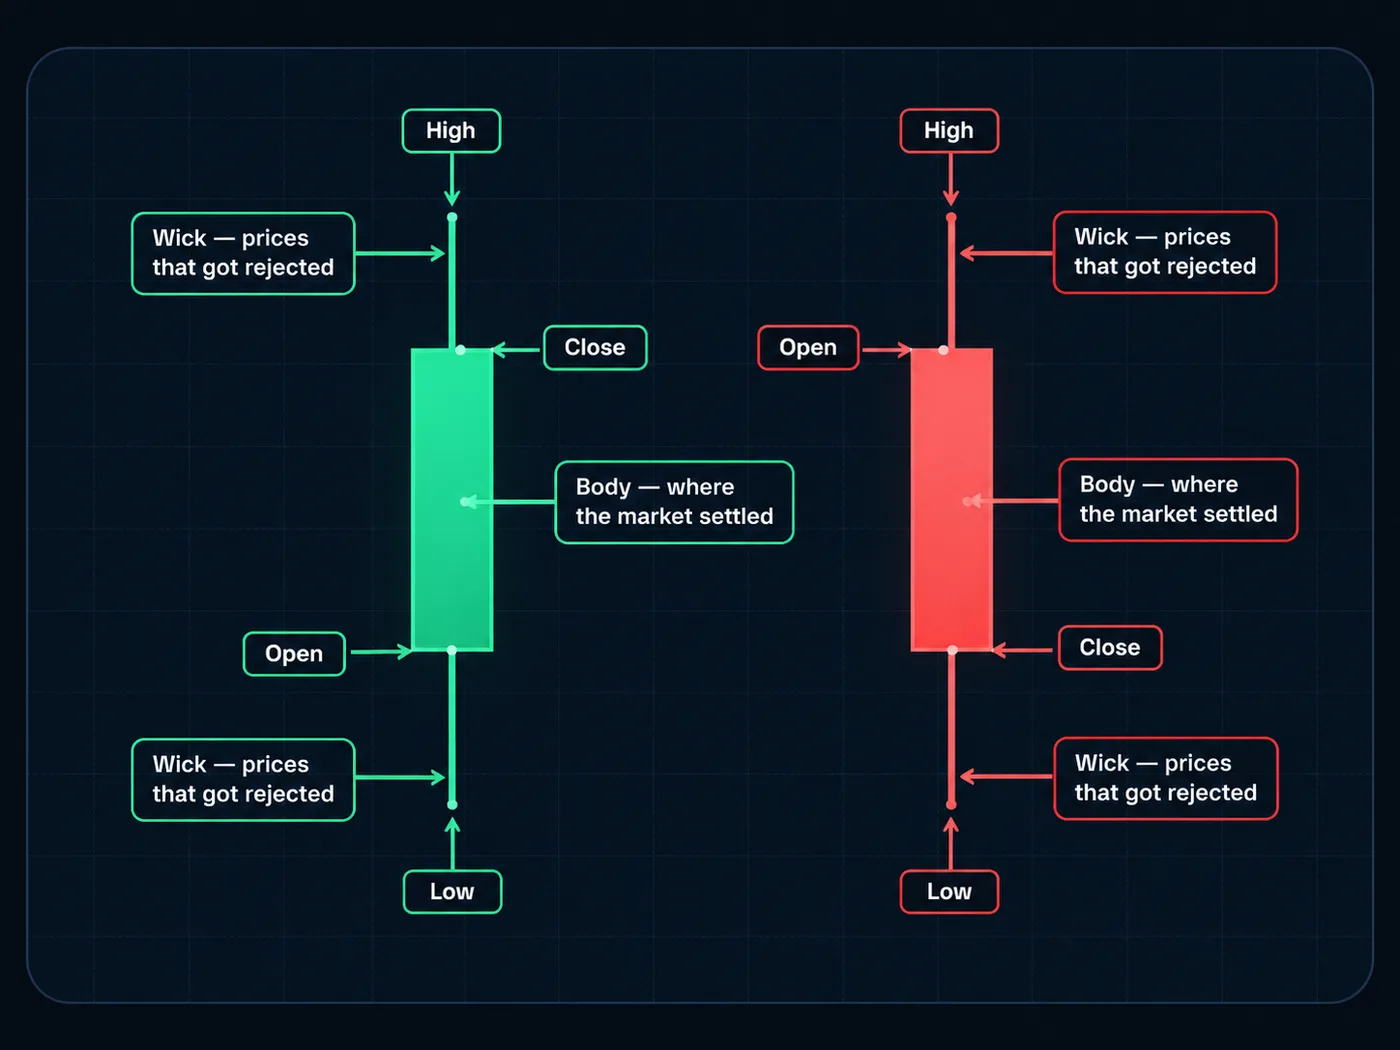
The parts of a candle
- The body is the thick part. It runs from the open to the close.
- The wicks are the thin lines above and below. They show the highest and lowest prices reached.
- The color tells you the direction. Green (or white) means it closed higher than it opened. Red (or black) means it closed lower.
A simple example
On a 1-hour chart, one candle covers 10:00 to 11:00. During that hour, a stock:
- opened at $20.00,
- dropped to $19.70,
- climbed to $20.60,
- and closed at $20.40.
That candle is green, because $20.40 is above $20.00. Its body runs from $20.00 to $20.40. The top Wick reaches $20.60 and the bottom wick reaches $19.70. In one picture, you see the whole hour's fight between buyers and sellers.
Why it matters
A candle tells a short story. A long green body says buyers were in control all the way to the close. A long top wick says buyers pushed up, but sellers shoved price back down before the close.
In our method, the close matters most. Only a candle body closing past a level counts as a real move. A wick poking through and pulling back doesn't. More in how to read candlestick charts.
A common mistake
Reading a candle before it has closed. A candle that looks strong halfway through the hour can finish with a long wick and a tiny body. Until the time is up, it's still changing. Wait for the close.
The other mistake is reading one candle alone. A single candle means more at a Support or Resistance level than in the middle of nowhere.
Questions
What timeframe does one candle cover?
Whatever you choose. On a daily chart, one candle is one day. On a 5-minute chart, it's five minutes. The chart's Timeframe sets it.
Why are they called candlesticks?
The thick body and thin wicks look like a candle. The style comes from Japanese rice traders centuries ago.
Do I need to memorize candle patterns?
Not to start. Knowing open, high, low and close, and where the candle closed, gets you most of the way. See candlestick patterns for beginners when you're ready.
Want the next step? We'll walk you through it.
Four free lessons by email, one every few days — each with a 10-minute exercise on a real chart.
Send Me the Free Lessons 4 short emails · No spam · Unsubscribe anytimeOr see the whole method, step by step:
See What’s Inside the Course Try everything free first. Decide when you're ready. · Open the free chart tool (works in the TradingView phone app)One chart idea a day, in plain English. Follow along: