
Home › Guides › Reading charts
Candlestick patterns for beginners: the 4 worth knowing (skip the rest)
There are dozens of named candle patterns. You need 4. And one simple idea matters more than all of them put together.
First: what a pattern really shows
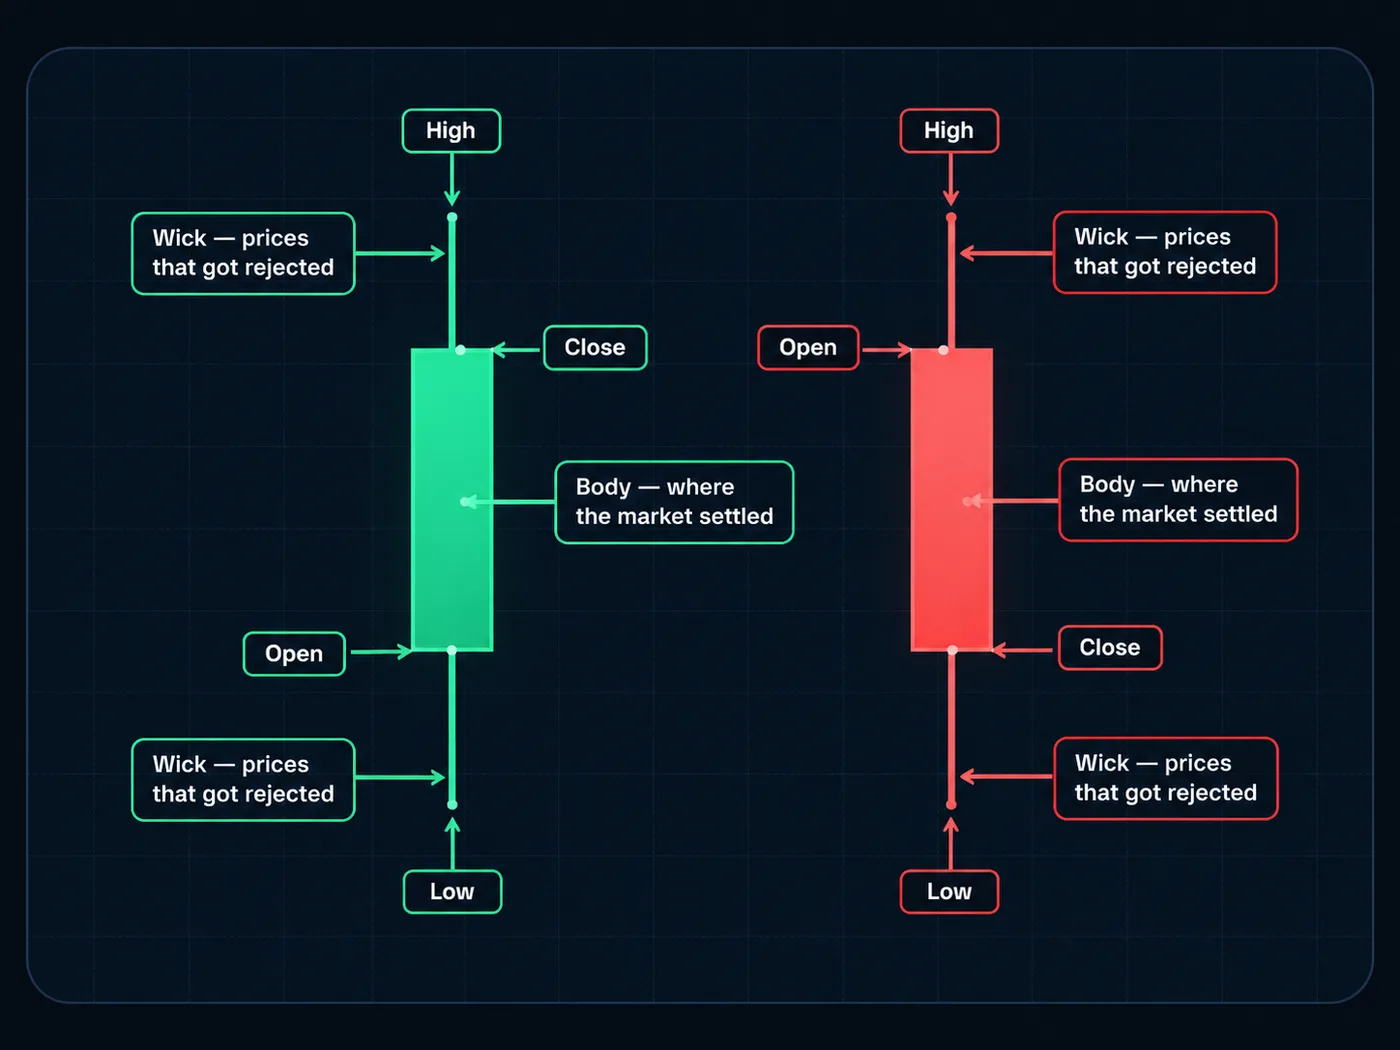
A candlestick shows four prices for one slice of time: open, high, low and close. The thick body runs from open to close. The thin wicks show prices price touched but didn't keep. New to this? Start with how to read a candlestick chart.
A pattern is just one or two candles that show a fight between buyers and sellers, and who won that round. That's useful. But one round isn't the whole fight.
1. The engulfing candle
What it looks like: a candle whose body completely covers the body of the candle before it, in the opposite color.
- Bullish engulfing: a small red candle, then a bigger green candle whose body wraps right around it.
- Bearish engulfing: a small green candle, then a bigger red one that wraps around it.
What it shows: one side took over fast. In a bullish engulfing, sellers had the last candle — then buyers pushed price back past where it opened, and kept going.
Watch for: size. A tiny candle "engulfing" an even tinier one says very little.
2. The pin bar (hammer)
What it looks like: a small body at one end of the candle with a long wick sticking out the other way. The long wick is at least about twice the body.
- Hammer (bullish pin bar): long wick below, body near the top. Price dropped hard, then got pushed back up before the close.
- Shooting star (bearish pin bar): long wick above, body near the bottom. Price jumped, then got pushed back down.
What it shows: a rejection. Price tried to go somewhere and got sent back. The long wick is the footprint of that rejection.
Watch for: where the wick points. A hammer in the middle of nowhere is just a candle with a long tail.
3. The inside bar
What it looks like: a candle whose whole range (high to low) fits inside the range of the candle before it.
What it shows: a pause. Price is coiling up and nobody is pushing yet. It doesn't say which way price will go next — only that a decision is coming.
How traders use it: they wait for a candle body to close past the high or low of the bigger candle, not just a wick, before they treat it as a real move.
4. The doji
What it looks like: a candle where the open and close are almost the same price, so the body is a thin line. Wicks can be short or long.
What it shows: a tie. Buyers and sellers ended the round even. After a long run up or down, that tie can hint that the push is running out of steam.
Watch for: a doji on its own is the weakest signal here. It's a "pay attention" sign, not a "do something" sign.
The quick comparison
| Pattern | What it shows | Weak when… |
|---|---|---|
| Engulfing | One side took over fast | The candles are tiny |
| Pin bar / hammer | Price got rejected | It forms in the middle of a range |
| Inside bar | A pause before a decision | You act before a body close |
| Doji | A tie between both sides | You treat it as a signal on its own |
Location beats the pattern
Here's the idea that matters most. The same candle means different things in different places.
A hammer in the middle of a chart, far from any level, is noise. The same hammer sitting right on a zone where price turned up three times before is a story: sellers pushed into an old floor, and buyers defended it again.
So before you look at the candle, look at where it is:
- Is it at a level? A support or resistance zone, or a supply and demand zone.
- Does it agree with the trend? A bullish candle at a floor in an uptrend has the wind behind it. The same candle in a downtrend is swimming upstream. See how to identify a trend.
- Then — and only then — does the candle tell you something useful.
A simple order: where is price (the zone) → which way is the bigger trend → what did the candle do. Pattern last, not first.
Common beginner mistakes
- Learning 40 patterns. More names don't add more skill. They add more reasons to click.
- Trading every pattern you see. Most of them form in places that don't matter.
- Acting before the candle closes. A hammer halfway through its time slice can turn into a big red candle by the close. Wait for the close.
- Forgetting the stop. Even a perfect pattern at a perfect zone can fail. Know where you're wrong first — see how to set a stop loss — and size it with the position size calculator.
Try it today
- Open a daily chart and mark two or three zones where price turned before.
- Scroll back and find every hammer, engulfing, inside bar and doji at those zones.
- Then find the same patterns away from any zone.
- Compare what happened next in each group. Write down what you notice.
That simple exercise teaches the "location first" idea better than any list of patterns can. Doing it on past charts, one candle at a time, is even better — see TradingView bar replay.
Questions
What is the most reliable candlestick pattern?
No pattern works on its own. Engulfing candles and pin bars tend to say the most, but only when they form at a level that matters and agree with the bigger trend.
How many candlestick patterns should a beginner learn?
Four is plenty: engulfing, pin bar, inside bar and doji. Knowing where to look matters far more than knowing more names.
Is a hammer bullish?
A hammer shows that sellers pushed price down and buyers pushed it back. At a floor in an uptrend, that's a bullish hint. In the middle of nowhere, it means very little.
Should I wait for the candle to close?
Yes. A candle can change shape completely before its time slice ends. Only judge the pattern once the candle has closed.
Want the next step? We'll walk you through it.
Four free lessons by email, one every few days — each with a 10-minute exercise on a real chart.
Send Me the Free Lessons 4 short emails · No spam · Unsubscribe anytimeOr see the whole method, step by step:
See What’s Inside the Course Try everything free first. Decide when you're ready. · Open the free chart tool (works in the TradingView phone app)One chart idea a day, in plain English. Follow along: