
Home › Guides › Reading charts
How to read candlestick charts: learn one candle, read them all
A candlestick chart looks busy. It isn't. Every candle tells you just 4 prices, and once you can read one, you can read the whole chart.
What one candle shows
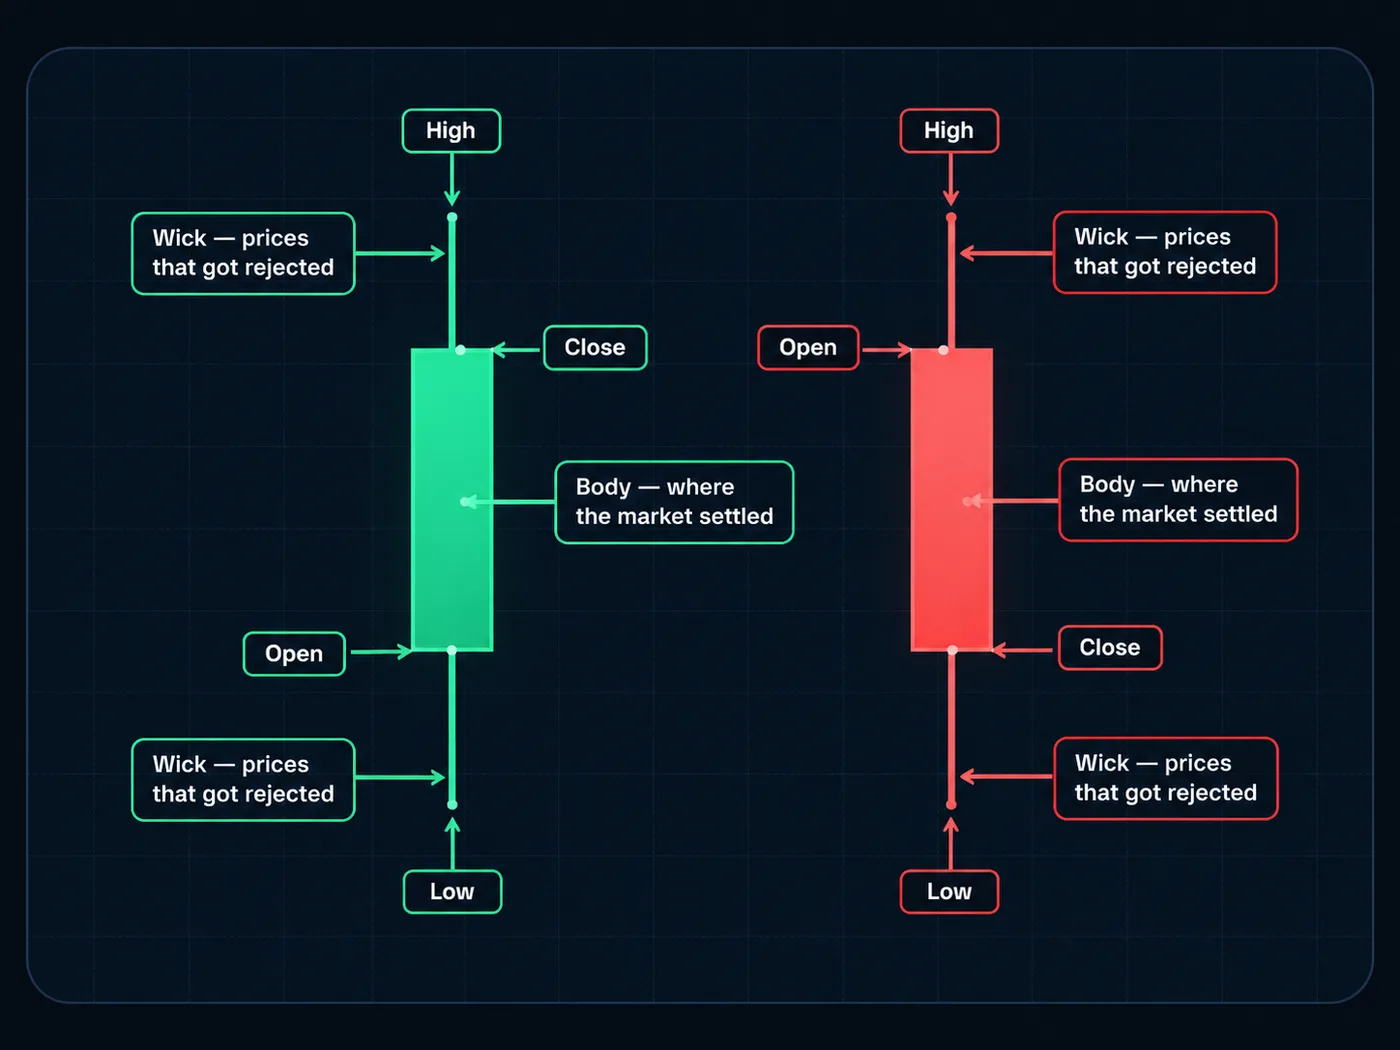
Each candle covers one slice of time — one minute, one hour, one day. You pick the slice. Inside that time, the candle records four prices:
- Open — the price when the time slice started.
- Close — the price when it ended.
- High — the highest price reached.
- Low — the lowest price reached.
The thick part is the body. It runs from the open to the close. The thin lines above and below are the wicks. They show prices the market touched but didn't hold on to.
Green and red
On most charts, green means price closed higher than it opened — buyers won that slice of time. Red means it closed lower — sellers won. A long body means one side clearly won. A short body means it was close.
Step back: which way is it going?
One candle is a word. The chart is a sentence. Zoom out and look at the last few dozen candles together:
- Climbing — each push up goes higher, and each dip stops higher than the last one.
- Falling — each drop goes lower, and each bounce stops lower than the last.
- Stuck in a box — price bounces between the same two areas. Most of the time, the right move here is to wait.
Pro habit: use two zooms. Check a daily chart to see the big direction. Then use a 1-hour chart to find your spot. Trade with the bigger chart, never against it. More in multiple timeframe analysis.
The test for a real move
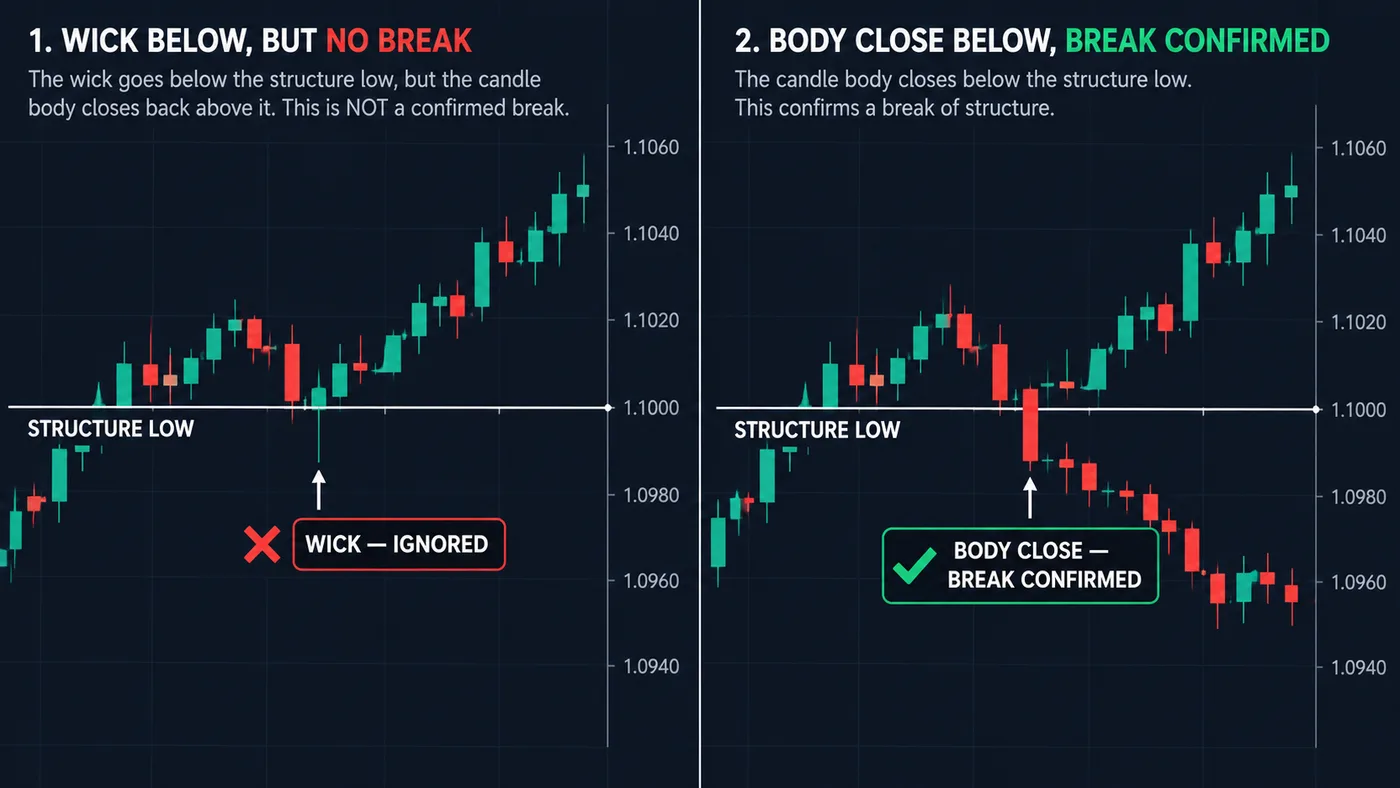
Here's where most beginners get caught. Price pokes through a level, they jump in — and it snaps right back. That poke was only a wick.
The simple test: only a candle whose body closes past the level counts. A wick that pokes through and comes back is a fakeout. A body that closes clearly past it is a real move. Wait for the close. It costs you a few minutes and saves you from a lot of traps.
Try it today (5 minutes)
- Open any chart on a free TradingView account.
- Zoom out. Is price climbing, falling, or stuck?
- Find the last place price turned around, and draw a line there.
- Scroll back and find one fake-out wick and one real body close through a line.
Want help spotting those turning points? Our free StructureX chart tool marks them on your chart for you — on your phone or computer.
Questions
What timeframe should a beginner use for candlestick charts?
Start with the daily chart to see the big direction, then a 1-hour chart to look closer. Very short charts (1–5 minutes) move fast and are full of noise — they're harder, not easier.
Do candle colors mean the same thing on every chart?
Usually green (or white) means price closed higher and red (or black) means it closed lower, but you can change the colors in your chart settings. Check the open and close, not just the color.
Are candlestick patterns enough to trade on?
Not on their own. A pattern means much more at an important level — like the last place price turned around — than in the middle of nowhere. See candlestick patterns for beginners.
Want the next step? We'll walk you through it.
Four free lessons by email, one every few days — each with a 10-minute exercise on a real chart.
Send Me the Free Lessons 4 short emails · No spam · Unsubscribe anytimeOr see the whole method, step by step:
See What’s Inside the Course Try everything free first. Decide when you're ready. · Open the free chart tool (works in the TradingView phone app)One chart idea a day, in plain English. Follow along: