
What is market structure in trading?
In one line: Market structure is the pattern of a chart's turning points, the highs and lows, which shows whether price is trending up, trending down, or moving sideways.
The three shapes
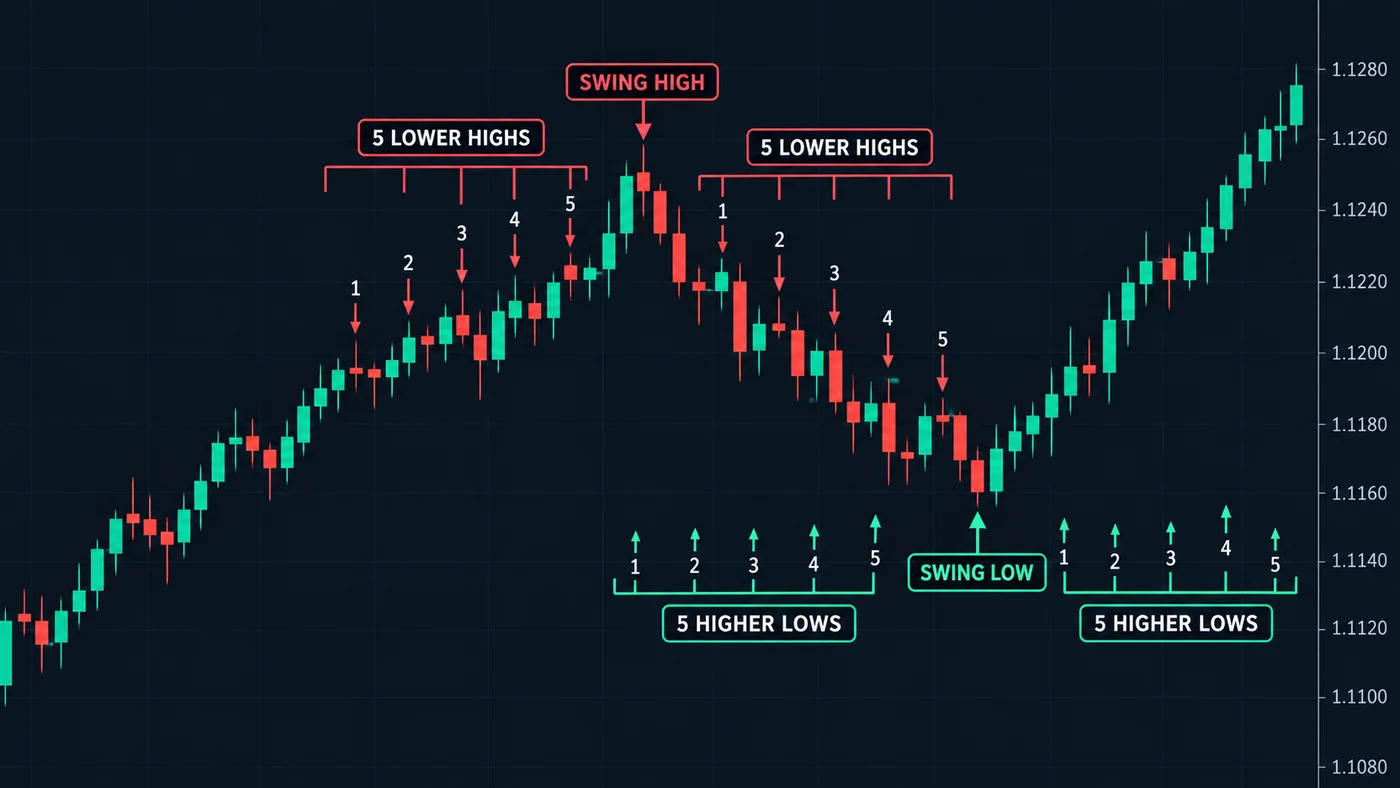
Look only at the places where price turned around. They form one of three patterns:
| Pattern | Highs | Lows | What it means |
|---|---|---|---|
| Uptrend | Each one higher | Each one higher | Buyers in control |
| Downtrend | Each one lower | Each one lower | Sellers in control |
| Range | Roughly level | Roughly level | No side in control |
A simple example
On a daily chart, a stock turns down at $40, pulls back to $36, climbs to $44, pulls back to $39, then climbs to $47.
Write the turning points down: highs at 40, 44, 47; lows at 36, 39. Each high is above the last, and each low is above the last. That's an uptrend, a series of Higher highs and higher lows.
The structure stays up as long as price keeps holding above $39, the last low. If a candle body closes below $39, the pattern has broken.
Why it matters
Market structure answers the first question on any chart: which way is it going? Once you know that, you can trade with it instead of against it. In an uptrend, you look for buys near new higher lows. In a downtrend, you look for sells near lower highs. In a range, you may sit out.
It also tells you when to change your mind. A Break of structure confirms the trend; a Change of character warns it may be turning.
A common mistake
Reading structure on too small a chart. A 1-minute chart can show a "downtrend" that's just a tiny dip inside a daily uptrend. Check the bigger chart first and trade in its direction. More in multiple timeframe analysis.
Our free StructureX chart tool marks the turning points for you, which makes the pattern easy to see.
Questions
Is market structure the same as a trend?
Close. A Trend is the direction; structure is the set of highs and lows that shows it, including when the market is just moving sideways.
Which timeframe should I read structure on?
Start with the daily chart, then zoom in. The bigger chart sets the direction. See how to identify a trend.
Does market structure work on forex and crypto?
Yes. Any chart with highs and lows has a structure, whether it's stocks, forex, crypto or futures.
Want the next step? We'll walk you through it.
Four free lessons by email, one every few days — each with a 10-minute exercise on a real chart.
Send Me the Free Lessons 4 short emails · No spam · Unsubscribe anytimeOr see the whole method, step by step:
See What’s Inside the Course Try everything free first. Decide when you're ready. · Open the free chart tool (works in the TradingView phone app)One chart idea a day, in plain English. Follow along: