
Are higher timeframes too slow? What zooming out really changes
A daily chart can feel like watching paint dry next to a 1-minute one. But slower candles don't mean smaller trades or less to learn. They change how often you decide, and how clear each decision is.
The myth
Fast charts feel exciting. There's always a new candle and always something happening. Slower charts can feel like nothing's going on.
So it's easy to assume faster charts mean more chances, and more chances mean more progress. The explanation skips what each chance actually costs.
What's actually true
The risk per trade doesn't change
On any timeframe, a trade risks about the same: your fixed 1%. What changes is the stop distance, and so the size.
Example: a $5,000 account risks 1% = $50. On a 5-minute chart the stop is $0.25 away: $50 ÷ $0.25 = 200 shares. On a daily chart the stop is $2.50 away: $50 ÷ $2.50 = 20 shares. Both trades risk $50. The daily trade is smaller in shares, with more room for normal wiggles. A math example, not a promise.
So a higher timeframe isn't a "smaller" trade in risk. It's the same risk, spread over a bigger move.
Costs take a smaller bite
Every trade pays the spread and fees. On a small target, they're a big share. On a bigger target, they're a small one.
Example: costs are $0.04 a share. A 5-minute target of $0.50 loses 8% to costs. A daily target of $5.00 loses 0.8%. Same costs. Very different share of the move.
Less noise, clearer signals
Short charts show every tiny wiggle. Many of those wiggles mean little. A daily candle sums up a whole day of trading, so a body closing past a level carries more weight. Levels from bigger charts also tend to matter more, because more traders see them.
Fewer trades, but more thinking per trade
A daily chart might give you 2 or 3 setups a week, not 20 a day. That can feel slow. But each one gets your full attention, and the total number of trades in your log still grows week by week.
What zooming out doesn't fix
- Gaps: on daily charts, price can open past your stop after news overnight. Smaller size limits the damage.
- Patience: trades take days or weeks to play out.
- Losing streaks: they still happen, just more slowly.
What to do instead
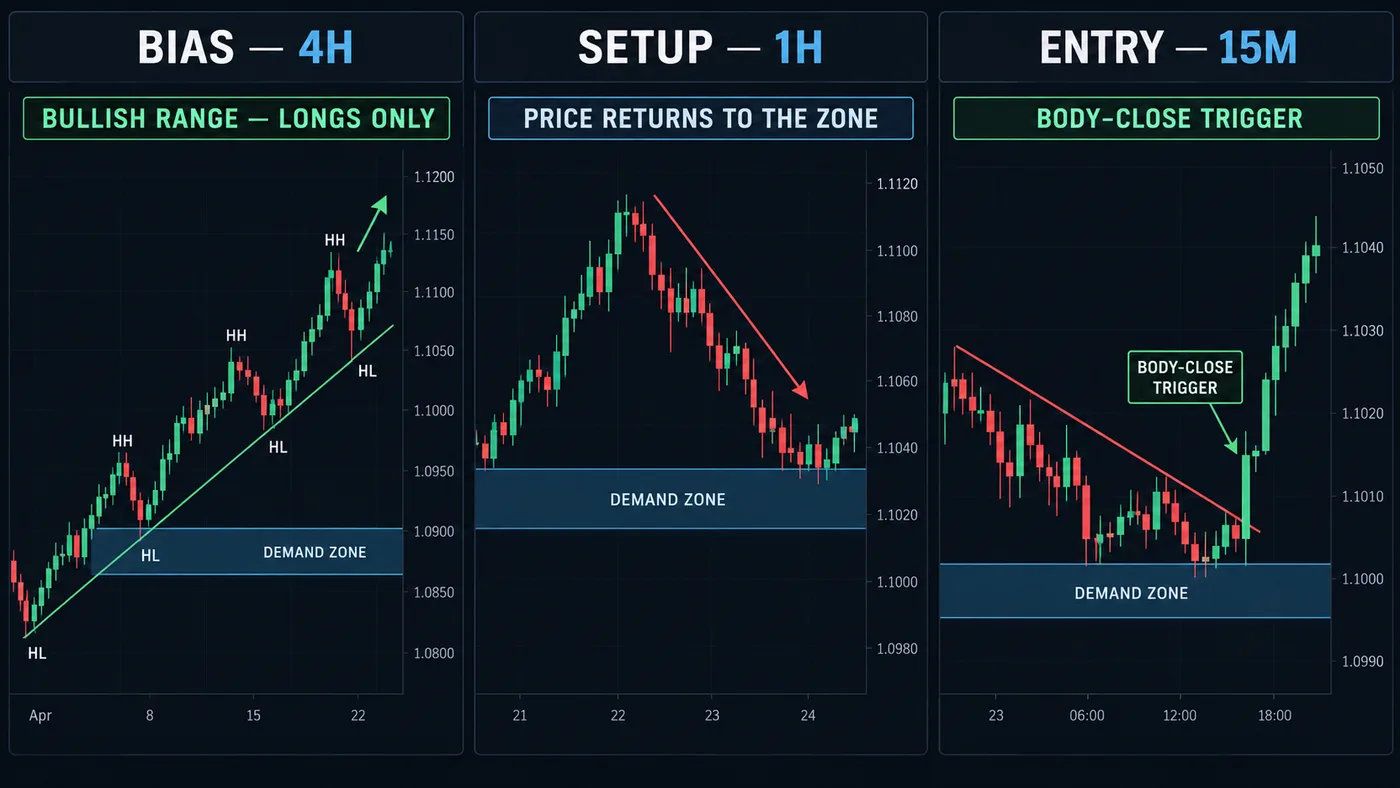
- Start on the daily chart to find the trend and the key levels, even if you trade a smaller chart.
- Trade one step down at most as a beginner, for example daily for direction, 4-hour or 1-hour for entries. See multiple timeframe analysis.
- Keep the risk fixed at about 1%. Let the stop set the size with the position size calculator.
- Set alerts and step away. See TradingView alerts.
- Compare both in practice. Log 30 replay trades on a 5-minute chart and 30 on a daily. Compare the rules followed and the results in units.
Common follow-up mistakes
- Using the same share size on every timeframe. That makes daily trades risk far more than intraday ones.
- Checking the daily chart every 5 minutes. The candle hasn't closed. There's nothing new to decide.
- Switching down a timeframe out of boredom. That's how plans get broken.
- Thinking slow means no skill needed. It needs the same rules, just with more patience.
Questions
Are higher timeframes better for beginners?
Many beginners find them easier: fewer decisions, more time to think, and costs are a smaller share of each move. The risk per trade stays the same either way.
What timeframe do most traders use?
It varies by style. Day traders often use 1- to 15-minute charts, swing traders 4-hour and daily, and position traders daily and weekly. Most check a bigger chart first.
Is the daily chart good for trading?
It's widely used because each candle sums up a full day, levels are widely watched, and decisions happen once a day. Overnight gaps are the main extra risk.
Do higher timeframes need a bigger account?
Not necessarily. Wider stops mean smaller sizes for the same risk. Markets with small sizes, like fractional shares or micro contracts, make this easier with small accounts.
Want the next step? We'll walk you through it.
Four free lessons by email, one every few days — each with a 10-minute exercise on a real chart.
Send Me the Free Lessons 4 short emails · No spam · Unsubscribe anytimeOr see the whole method, step by step:
See What’s Inside the Course Try everything free first. Decide when you're ready. · Open the free chart tool (works in the TradingView phone app)One chart idea a day, in plain English. Follow along: