
Bar chart vs candlestick: the same 4 prices, drawn 2 ways
A bar chart and a candlestick chart hold exactly the same information. Open, high, low, close. The only difference is how your eye reads it, and that matters more than it sounds.
The short answer
A bar chart (also called an OHLC chart) draws each period as a thin vertical line. A small tick on the left marks the open. A small tick on the right marks the close.
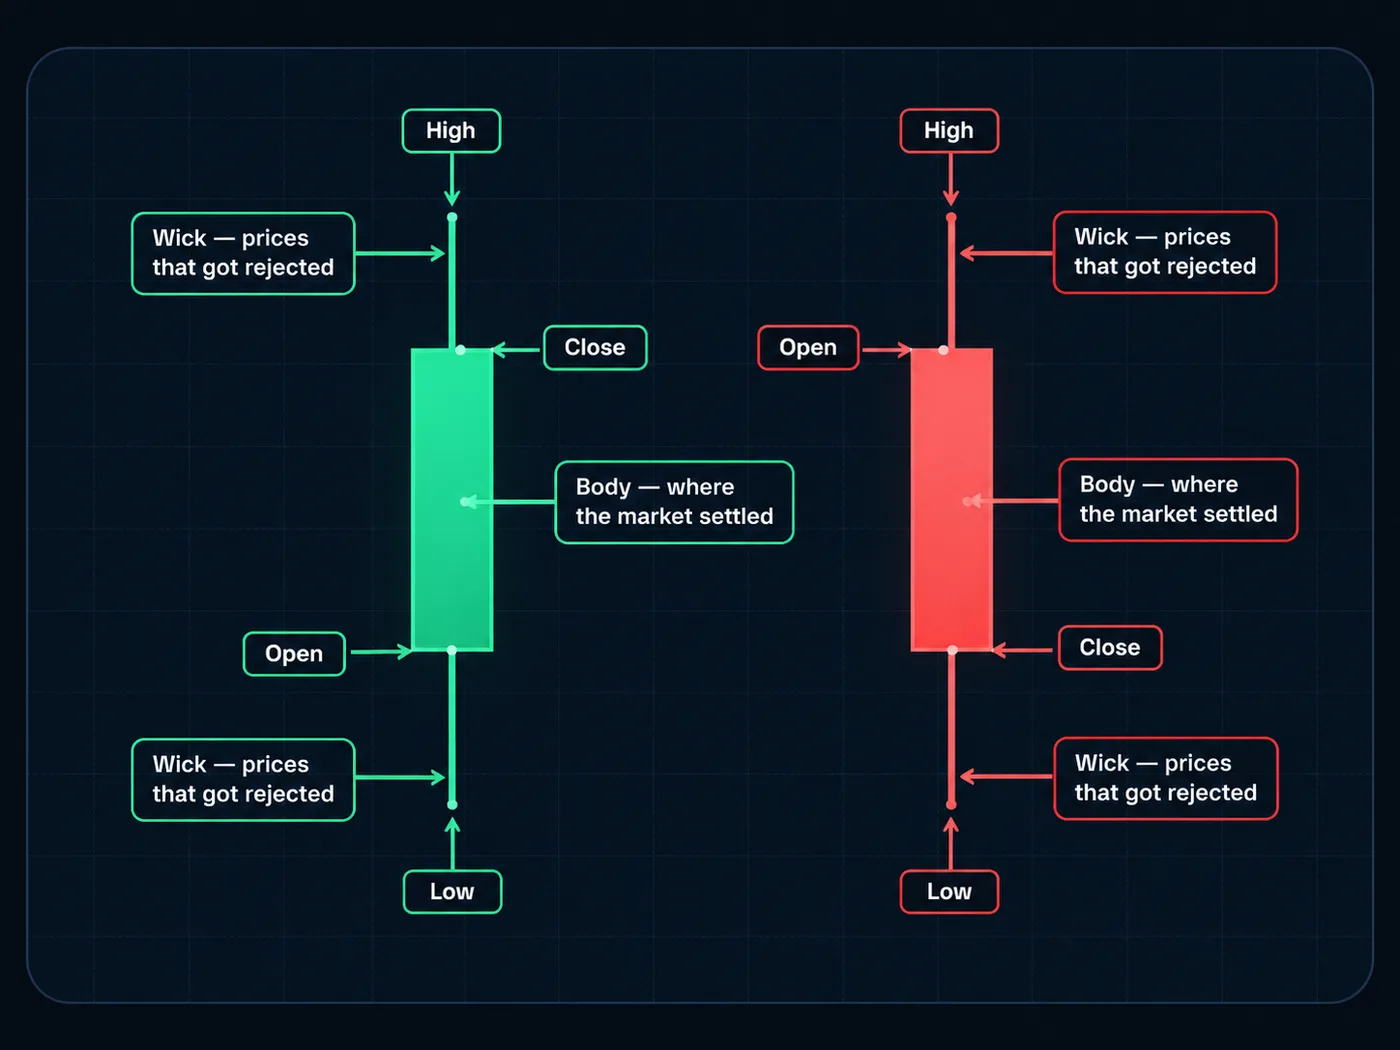
A candlestick chart draws the same period as a box (the body) between the open and close, with thin lines (wicks) up to the high and down to the low. The colour shows if price closed up or down.
Same four prices. The candle makes the open-to-close move much easier to see.
Side by side
| Bar chart (OHLC) | Candlestick | |
|---|---|---|
| Data shown | Open, high, low, close | Open, high, low, close |
| Open | Tick on the left | One end of the body |
| Close | Tick on the right | Other end of the body |
| Up or down period | Tick positions (often coloured too) | Body colour, very easy to spot |
| Takes up space | Thin, fits many bars | Wider |
| Easy to read at a glance | Harder at first | Easier for most people |
| Origin | Western charting | Japan, brought to the West by Steve Nison around 1991 |
How to read an OHLC bar
Picture one vertical line.
- The top of the line is the high.
- The bottom is the low.
- The left tick is where price opened.
- The right tick is where it closed.
If the right tick is higher than the left, price closed up for that period. See Bar chart (OHLC).
How to read a candle
Picture a box with a thin line through it.
- The body is the box from open to close.
- A green (or white) body: close is above open. Price went up.
- A red (or black) body: close is below open. Price went down.
- The wicks reach to the high and the low. See Wick.
A quick example with numbers
One hour on a stock: open $50, high $53, low $49, close $52.
- As a bar: a line from $49 to $53. A left tick at $50. A right tick at $52.
- As a candle: a green body from $50 to $52. A wick up to $53. A wick down to $49.
Same hour, same prices. In the candle, the $2 gain jumps out at you. In the bar, you have to compare two small ticks.
Bar charts: strengths and limits
The good parts:
- Less visual weight. Big bodies don't pull your eye, so the high-low range stands out.
- Fits more history. Thin bars squeeze more onto a screen.
- Calmer. Some traders find fewer colours less emotional.
The limits:
- Harder to scan. Up and down periods don't jump out.
- Small ticks. On a phone, they're hard to see.
Candlesticks: strengths and limits
The good parts:
- Instant direction. Colour tells you up or down.
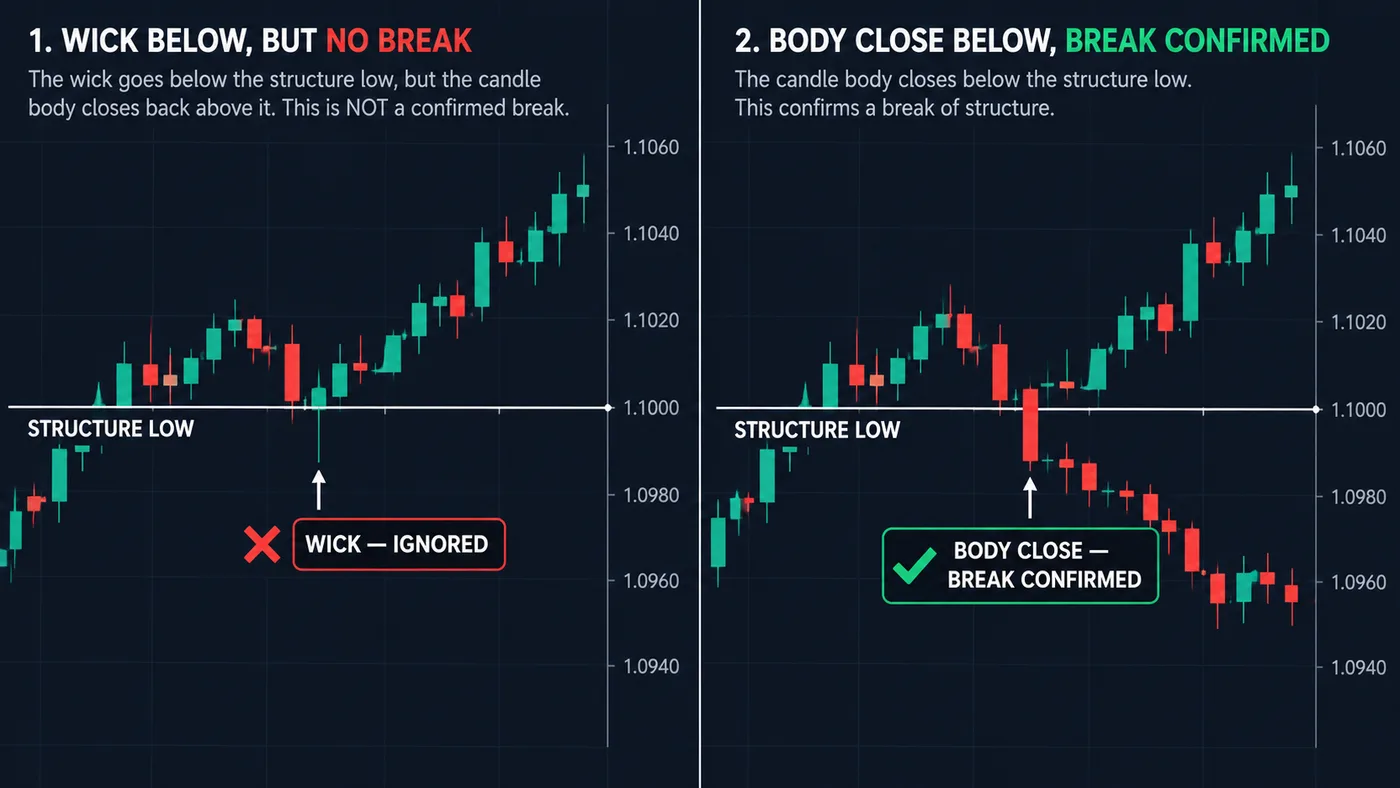
- Body vs wick is clear. That matters for rules like ours: only a candle body closing past a level counts, wicks don't.
- Patterns are easier to spot. See candlestick patterns for beginners.
The limits:
- Big candles feel loud. One huge red body can scare you more than the same move on a bar chart.
- Pattern hunting. It's easy to see "signals" in every candle.
Switching is one click. On TradingView, look for the chart-type button at the top of the chart. Try both on the same chart for a week and see which one you read faster.
Which fits you?
- New to charts? Candlesticks. Most guides, tools and courses use them, so learning is easier.
- Reading lots of history on one screen? Bars can fit more in.
- Find big candles stressful? Try bars, or a Line chart. See line chart vs candlestick.
Whatever you pick, the rules stay the same. Mark the levels. Wait for a close past them. Set the stop, then size from it with the position size calculator.
Common mistakes
- Mixing up the ticks. Left is open, right is close. Not the other way.
- Reading colour as a prediction. A green candle says what happened. It doesn't say what's next.
- Treating a wick like a close. A wick poking past a level is not a close past it.
- Switching chart types to find a better-looking setup. The data is the same. So is the setup.
Questions
What is the difference between a bar chart and a candlestick chart?
Both show the open, high, low and close. A bar uses small side ticks for the open and close; a candle draws a coloured body between them, which makes direction easier to see.
What does OHLC stand for?
Open, high, low, close. The four prices each bar or candle shows for its time period.
Which is better for beginners, bar or candlestick charts?
Most beginners find candlesticks easier, and most learning material uses them. Bar charts hold the same data, so either works.
Why do some traders prefer bar charts?
They're thinner, fit more history on a screen, and some traders find them calmer to read than big coloured bodies.
Want the next step? We'll walk you through it.
Four free lessons by email, one every few days — each with a 10-minute exercise on a real chart.
Send Me the Free Lessons 4 short emails · No spam · Unsubscribe anytimeOr see the whole method, step by step:
See What’s Inside the Course Try everything free first. Decide when you're ready. · Open the free chart tool (works in the TradingView phone app)One chart idea a day, in plain English. Follow along: