
Do chart patterns work every time? Why the stop comes first
Pattern cheat sheets make it look simple: spot the shape, take the trade. The shapes are real. What the sheets skip is how often they fail, and that failure is part of the plan, not a flaw in you.
The myth
Pattern posters show perfect examples. A clean head and shoulders, then a big drop. A neat bull flag, then a big rise.
Those examples are picked after the fact. Nobody makes a poster of the flag that broke the wrong way. So patterns end up looking far more reliable than they are.
What's actually true
A pattern is a probability, not a rule
A double bottom is two dips to the same area. Sometimes it marks a turn. Sometimes price breaks right through it. The shape doesn't know which one it will be.
That's why we never quote a success rate for a pattern. Rates you find online come from different markets, timeframes and rules, and they rarely match how a real person trades.
The same pattern can mean different things
A hammer candle in the middle of nowhere means little. A hammer at a level where price turned 3 times before, in an uptrend on the bigger chart, means more. Location matters more than the shape.
Failure is normal and useful
When a pattern fails, it often fails fast. That's useful information. A failed breakout can be the start of a move the other way. See breakout vs fakeout.
A simple numeric example
Example in units of risk: you trade the same pattern 20 times. It works 8 times and fails 12. Each failure is stopped at −1 unit. Each success reaches a target of +2.5 units. Total: 8 × 2.5 − 12 × 1 = +8 units. Now remove the stops and let 3 of the failures run to −5 each: 8 × 2.5 − 9 × 1 − 3 × 5 = −4 units. A math example, not a promise.
The pattern was the same in both cases. The stop made the difference. That's why the stop comes first.
What to do instead
- Check the bigger chart first. Does the pattern agree with its trend? See multiple timeframe analysis.
- Check the location. Is the pattern at a real zone where price turned before?
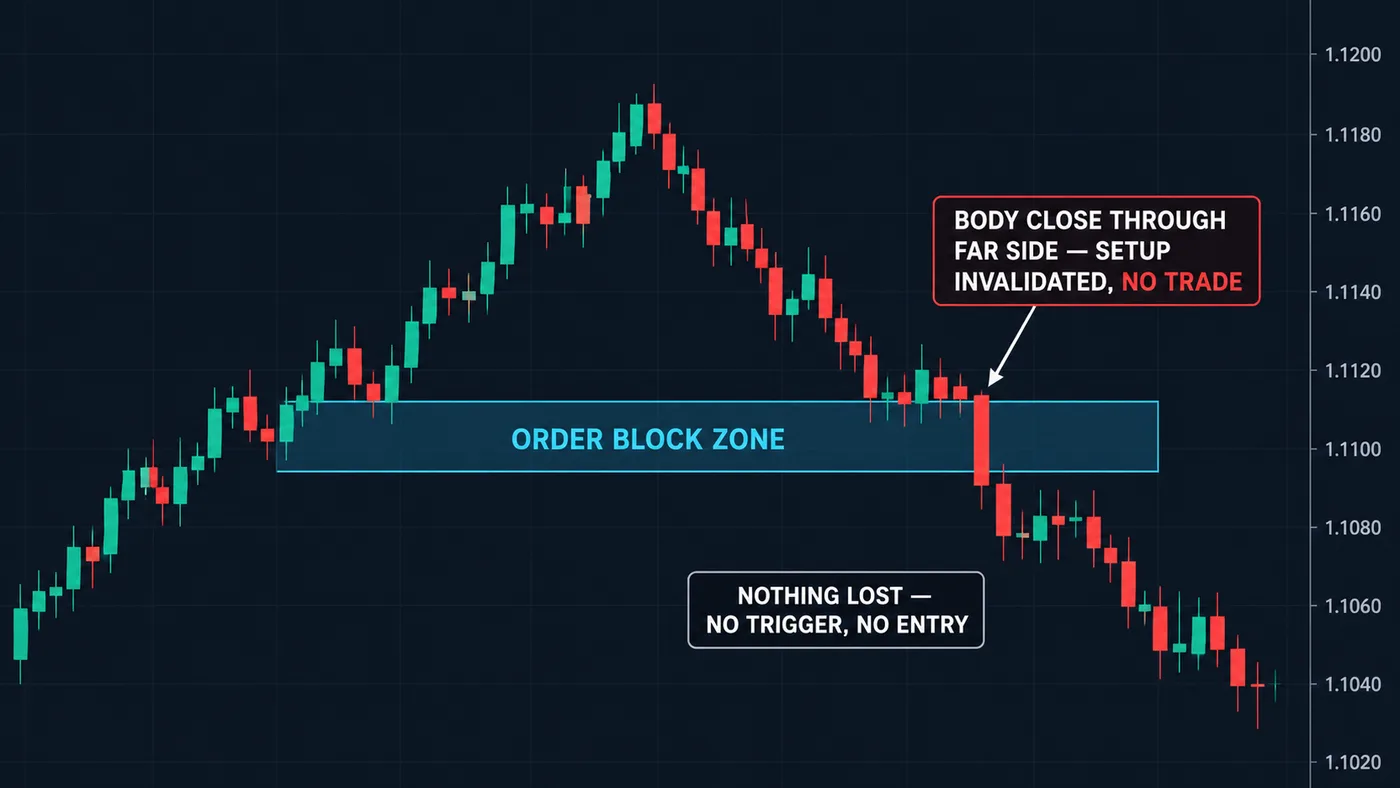
- Wait for confirmation. In our method, a candle body closes past the pattern's key line. A wick doesn't count.
- Place the stop where the pattern is clearly broken, for example past the far side of a flag or the second bottom of a double bottom.
- Size from the stop with the position size calculator, so a failure costs what you planned.
- Test one pattern on 50 past examples with replay, and log every one, including the failures.
Our chart patterns cheat sheet lists the shapes. This page is the part that keeps them honest.
Common follow-up mistakes
- Seeing patterns everywhere. Once you learn a shape, your eyes start finding it. Strict rules help: write down exactly what counts.
- Trading the pattern before it's finished. A half-built shape is a guess about a guess.
- Giving up on a pattern after 3 failures. Three is a tiny sample. Judge it on 50 or more.
- Moving the stop when the pattern looks "almost" broken. If the plan said out, it's out.
Try it today: on a replay chart, find 10 double bottoms. Before you press play, write "works" or "fails." Then check. Most people are humbled, in a helpful way.
Questions
How reliable are chart patterns?
They're far from certain. Results vary by market, timeframe and the exact rules used. Traders treat them as one input, with location and the bigger trend, and always with a stop.
What is the most reliable chart pattern?
No pattern is reliable on its own. Any pattern is more meaningful at a real level, in line with the bigger trend, after a confirming close. Test any pattern yourself before trusting it.
Why do chart patterns fail?
Because they describe what price did, not what it must do next. New orders, news or a bigger trend can overpower the shape. Failure is normal, which is why the stop is placed first.
Should I trade patterns as a beginner?
Patterns are a fine way to learn to read price. Start with simple ones, at clear levels, and practice them on past charts before using real money.
Want the next step? We'll walk you through it.
Four free lessons by email, one every few days — each with a 10-minute exercise on a real chart.
Send Me the Free Lessons 4 short emails · No spam · Unsubscribe anytimeOr see the whole method, step by step:
See What’s Inside the Course Try everything free first. Decide when you're ready. · Open the free chart tool (works in the TradingView phone app)One chart idea a day, in plain English. Follow along: