
Home › Guides › Chart patterns
Head and shoulders pattern: how to read it step by step
Three peaks. The middle one is the tallest. It's one of the most famous shapes on a chart, and most of what makes it useful happens after the shape is drawn.
What it looks like
Picture a person from the waist up: two shoulders, one head. It forms after price has been rising for a while.
Here's the shape, one step at a time:
- Left shoulder. Price rises to a peak, then dips.
- Head. Price rises again, past the first peak, to a new high. Then it dips again.
- Right shoulder. Price rises a third time, but it stops lower than the head. Then it turns down.
- Neckline. Draw a line through the two dips: the low after the left shoulder and the low after the head. That line is the neckline.
The neckline can be flat or tilted a little. What matters is that you can see it without forcing it.
What it's really telling you
Here's the thing most guides skip. You don't need to memorise the shape. You need to see what it means.
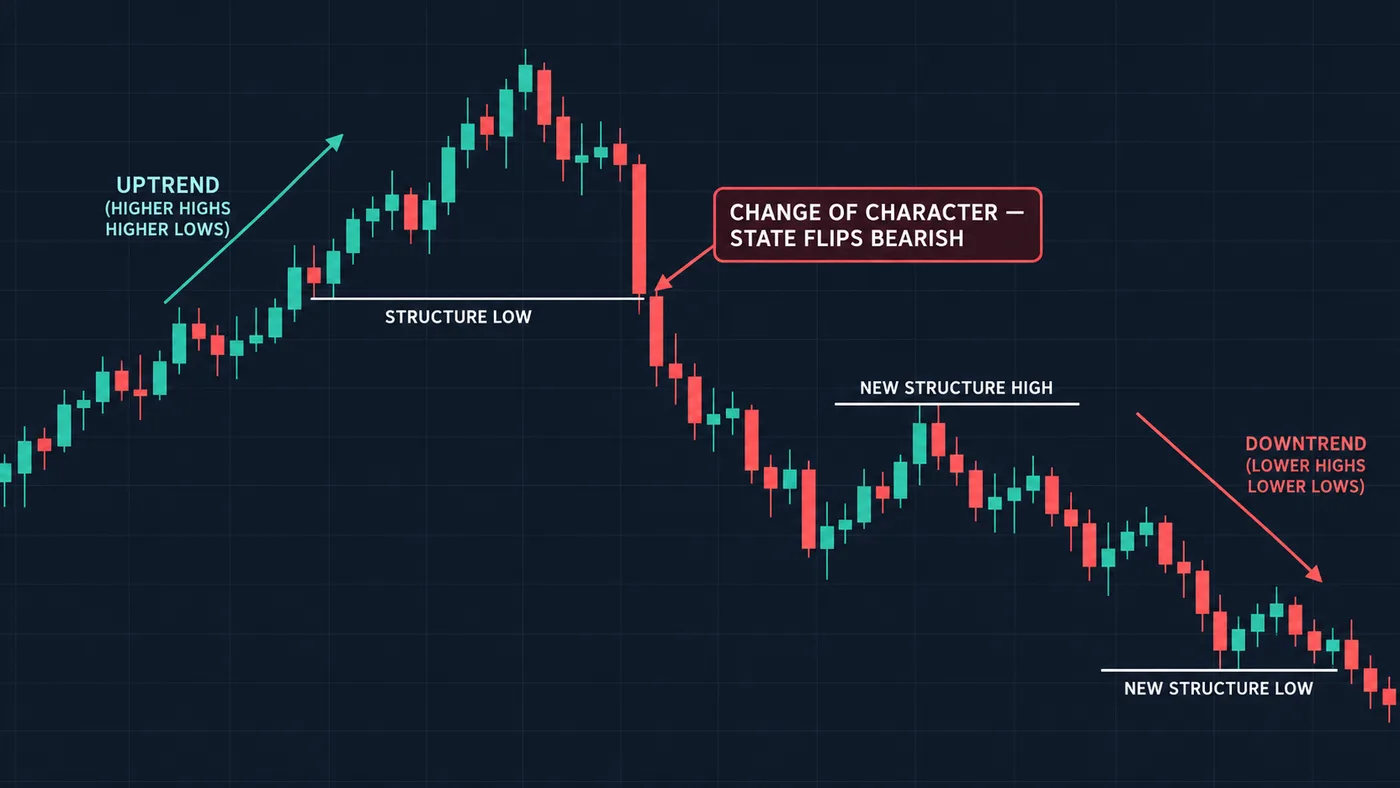
An uptrend is higher highs and higher lows. Each peak beats the last one, and each dip stays above the last one. See higher highs and higher lows.
The head and shoulders is that pattern running out of steam:
- The head is the last Higher high.
- The right shoulder is the first peak that fails to go higher.
- The neckline holds the last higher low.
So when price breaks the neckline, the uptrend has done two things at once. It stopped making new highs. And it broke its last low. In our method, that's a Change of character: the first real sign a trend may be turning.
The inverse head and shoulders
Flip it upside down and you get the inverse head and shoulders. It forms after a fall.
- Left shoulder: a low, then a bounce.
- Head: a lower low, then a bounce.
- Right shoulder: a low that stays above the head.
- The neckline runs through the two bounce highs.
It's the downtrend's version of running out of steam. Everything on this page works the same way, just flipped.
Where it matters
Location beats shape. A head and shoulders on its own is just three bumps. It earns attention when:
- It forms after a real trend. No trend before it means there's nothing to reverse.
- The head pokes into a known Resistance zone on the bigger chart. That's sellers showing up where they did before.
- The bigger chart agrees. A head and shoulders on a 5-minute chart, inside a strong daily uptrend, is often just a small pause. Check the bigger chart first. See multiple timeframe analysis.
The confirmation: a body close past the neckline
The pattern isn't finished until the neckline breaks. Until then, it's an uptrend with a lower peak, and uptrends do that all the time.
Our test is the same one we use everywhere:
A candle body must close below the neckline. A Wick poking through and snapping back doesn't count.
Wait for the candle to close. Mid-candle, a break can look certain and still close back above the line. Slow is simple.
Where a stop would logically go
The Stop loss (the price where you get out) comes from the chart, not from a feeling. There are two common spots.
- Above the right shoulder. If price climbs back over the right shoulder, the "running out of steam" story is wrong. This stop is logical but often wide.
- Above the retest. After the break, price often comes back up to the neckline from below and stalls there. An old floor can act as a new ceiling. A stop just above that retest high is tighter. The catch: sometimes no retest comes.
Your Position size then follows from the stop. A wider stop means a smaller size, so the money at risk stays the same.
A worked example
An illustration, not a real trade.
- Left shoulder peaks at 40, dips to 36.
- Head peaks at 44, dips to 36.50.
- Right shoulder peaks at 41, then turns down.
- A daily candle body closes at 35.50, below the neckline.
Say the account is 10,000 units and the rule is 1% risk, so 100 units at risk.
- Stop above the right shoulder: 41.20. Distance from 35.50 is 5.70. Size = 100 ÷ 5.70 ≈ 17 shares.
- Stop above a retest: price bounces to 36.40 and stalls. Entry 36.20, stop 36.70. Distance 0.50. Size = 100 ÷ 0.50 = 200 shares.
Same 100 units at risk either way. The position size calculator does this in seconds. A math example, not a promise. Either trade can still lose.
What failure looks like
It fails often. That's why the stop comes first.
- The neckline holds. Price dips to it, bounces, and makes a new high. The pattern never finished.
- The break snaps back. A body closes below the neckline, then the next candles close back above it. That's a trap. See breakout vs fakeout.
- The right shoulder grows. Price climbs past the head. Now it's a new higher high, and the uptrend is still alive.
When price closes back above the right shoulder, the idea is over. Get out, log it, move on.
Common mistakes
- Calling it early. Selling at the right shoulder before the neckline breaks. You're guessing the ending.
- Seeing it everywhere. Any three bumps can look like a head and shoulders if you want them to.
- Forcing the neckline. Bending a line through candle bodies so it "fits".
- Ignoring the trend before it. No uptrend before it, no top to call.
Try it today on TradingView
About 15 minutes, no money needed.
- Open a daily chart of any big stock or index. Scroll back a year or two.
- Turn on Bar Replay and pick a start point before a clear top. See TradingView bar replay.
- Step forward one candle at a time. Never peek ahead.
- When you think you see a left shoulder and a head, write it down. Mark the neckline.
- Keep stepping. Did a body close below the neckline? Or did price make a new high?
- Log the result either way, with the stop you would have used.
Do this 10 times and you'll see how often the shape starts but never finishes. That's the lesson. Our free chart tool marks the turning points for you, so the shoulders and the neckline are easier to spot: add it on TradingView.
Questions
Is the head and shoulders pattern bullish or bearish?
The normal version forms at the top of a rise and points to a possible turn down. The inverse version forms after a fall and points to a possible turn up. Neither is certain until a candle body closes past the neckline.
How do you confirm a head and shoulders pattern?
Wait for a candle body to close past the neckline. A wick through it doesn't count. Many traders also watch for price to come back to the neckline and stall there.
Where do you put a stop loss on a head and shoulders?
A common spot is just past the right shoulder. A tighter option is just past the high of a retest of the neckline, if one happens. Then size the trade so the money at risk stays the same.
How reliable is the head and shoulders pattern?
No honest source can give you one fixed number. It fails often, especially on small charts and against the bigger trend. That's why the stop and the size come first.
Want the next step? We'll walk you through it.
Four free lessons by email, one every few days — each with a 10-minute exercise on a real chart.
Send Me the Free Lessons 4 short emails · No spam · Unsubscribe anytimeOr see the whole method, step by step:
See What’s Inside the Course Try everything free first. Decide when you're ready. · Open the free chart tool (works in the TradingView phone app)One chart idea a day, in plain English. Follow along: