
Home › Guides › Markets & the economy
What moves stock prices? 6 forces, explained simply
Every stock move comes down to one thing: buyers got more eager than sellers, or the other way round. Six forces decide which. Learn them and the headlines start to connect to the chart.
The one rule under all of it
Price is the last price a buyer and a seller agreed on. It rises when buyers are more eager than sellers. It falls when sellers are more eager.
So "what moves stock prices?" really means: what makes people more eager to buy or sell? Here are the 6 big answers. If the basics are new, start with how the stock market works.
1. Earnings: the company's report card
Every quarter, US public companies report their results. The headline numbers are revenue (money coming in) and earnings (what's left after costs).
Here's the part most people miss. The stock doesn't react to whether the numbers are good. It reacts to whether they're better or worse than expected.
- Good numbers, but below what people hoped? The stock can fall.
- Weak numbers, but better than feared? The stock can rise.
Earnings days often bring a big Gap, where the stock opens far from yesterday's close.
2. Guidance: what the company says next
Along with results, many companies give guidance: their own forecast for the next quarter or year.
Guidance can matter more than the results themselves. The past is known. The future is what buyers and sellers are trying to price.
3. Interest rates
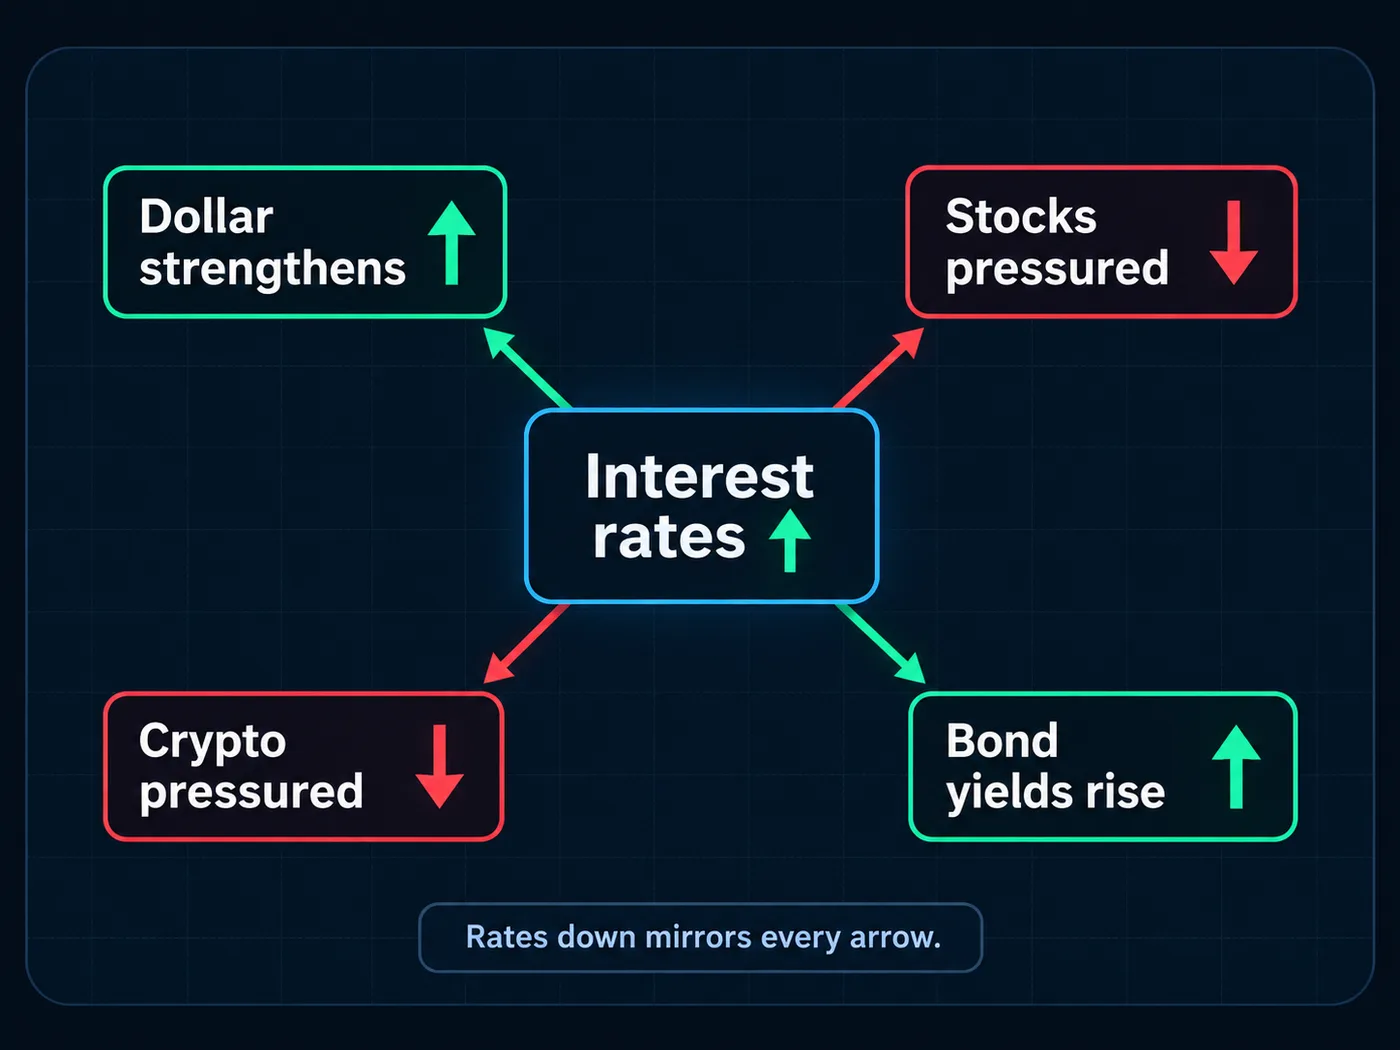
When the Federal Reserve raises or cuts interest rates, it changes the cost of money for everyone.
- Higher rates make borrowing more expensive and make safe savings pay more. Stocks have more competition.
- Lower rates do the reverse.
The Fed's rate-setting group, the FOMC, meets 8 times a year. Its statement comes out at 2:00 pm ET, with a press conference at 2:30 pm. Our guide on how interest rates affect stocks goes deeper.
4. Economic news
Big reports on the economy can move the whole market in seconds. Two of the biggest:
- CPI (inflation), released monthly by the Bureau of Labor Statistics at 8:30 am ET.
- The jobs report, usually on the first Friday of the month at 8:30 am ET.
Why do they matter? Because they change what people expect the Fed to do next. Hot inflation can mean higher rates for longer. See CPI and FOMC days for what to check before those days, and how to read an economic calendar to find them.
5. The whole market's mood
Most stocks move with the crowd. On a day when the S&P 500 Index drops sharply, many good companies drop with it.
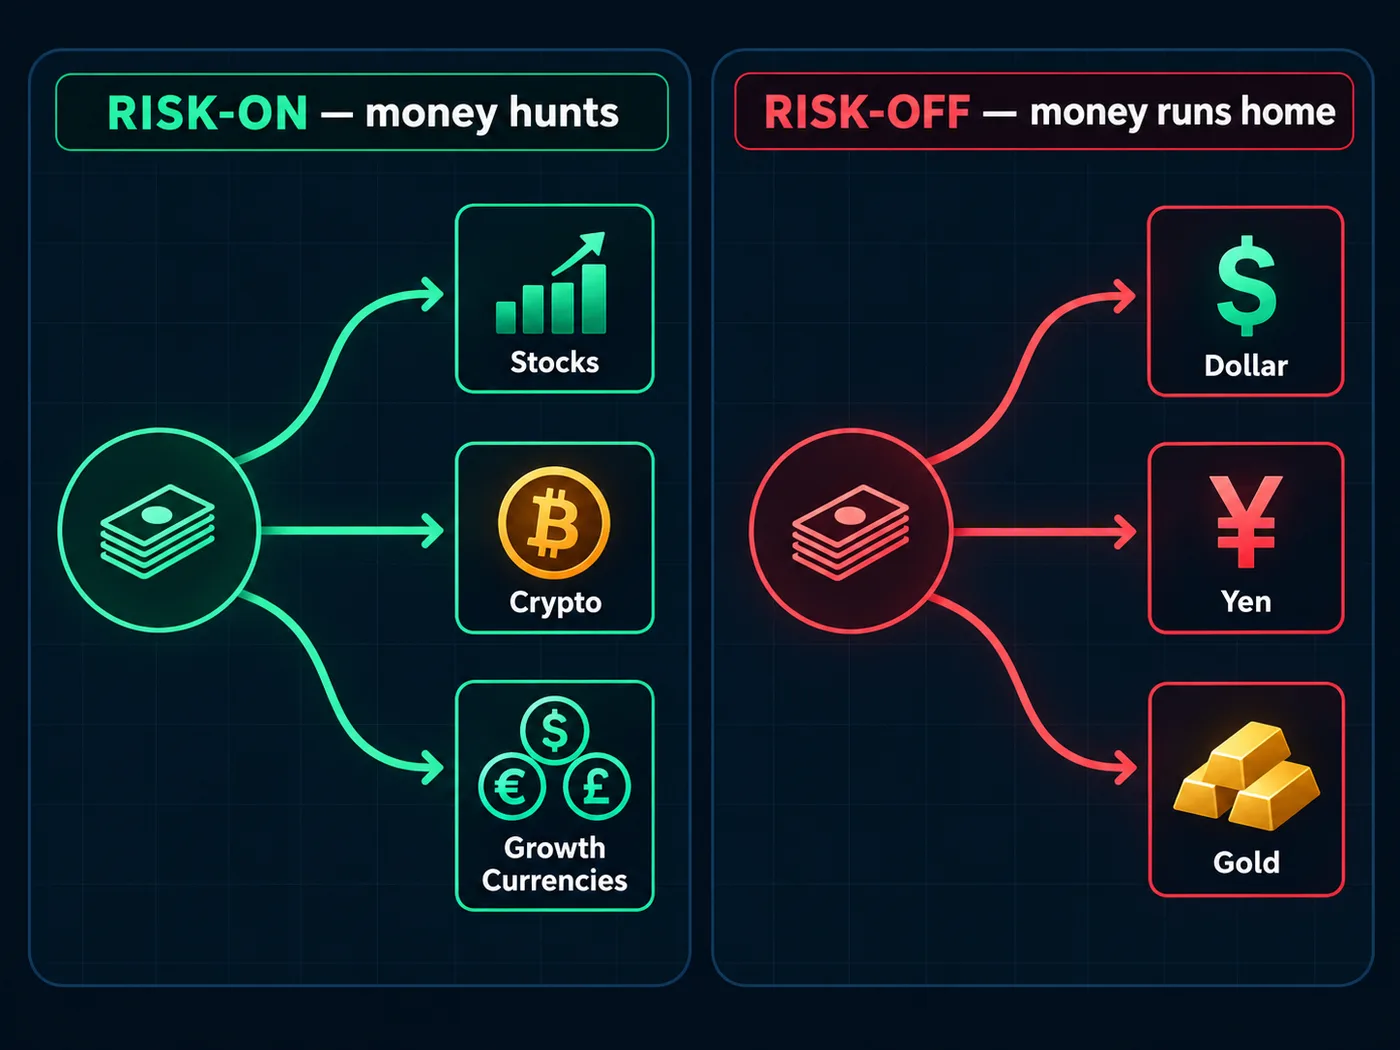
Traders call this risk-on and risk-off:
- Risk-on: people feel confident and buy riskier assets, like fast-growing tech stocks.
- Risk-off: people feel nervous and move toward safer things, like cash, bonds or gold.
Sectors matter too. If one big chip maker reports bad news, other chip stocks often move in sympathy.
6. Supply and demand on the chart
Some moves have no headline at all. They come from where buyers and sellers are waiting.
Price often reacts at places where it turned around before. Those areas are support and resistance. Big orders resting near those levels can stop a fall or cap a rise.
Volume, the number of shares traded, shows how much effort is behind a move. A big move on big volume has more people behind it than the same move on light volume. Our volume guide shows how to read it.
Long term vs short term
The 6 forces work on different clocks:
| Force | Usually matters most over |
|---|---|
| Earnings and guidance | Days to years |
| Interest rates | Months to years |
| Economic news | Minutes to weeks |
| Market mood | Hours to months |
| Supply and demand at levels | Minutes to days |
Over many years, a company's actual business tends to matter most. Over a day, news and mood can swamp everything else.
What this means for reading a chart
You don't need to predict the news. Nobody can do that reliably. What helps is knowing when news is coming, so it doesn't surprise you.
That's why the chart and the calendar work together. The chart shows where price is and where the levels are. The calendar shows when a big push might arrive.
A simple rule many traders use: don't open a new short-term trade in the minutes before CPI, the jobs report or a Fed decision. Wait for the dust to settle and for a candle to close.
Try it today
- Pick one stock you know.
- Find its next earnings date.
- Check this week's economic calendar for CPI, jobs or Fed days.
- Open its daily chart and mark the last 2 places price turned around.
Questions
What causes a stock price to go up?
More eager buyers than sellers. That eagerness usually comes from better-than-expected earnings, upbeat guidance, falling interest rates, good economic news or a confident overall market mood.
Why do stocks drop after good earnings?
Because the price already reflected high hopes. If results are good but below what people expected, or the company's guidance for the future is weak, sellers can outnumber buyers.
Do interest rates affect stock prices?
Yes. Higher rates raise borrowing costs and make safe savings more attractive, which can weigh on stocks. Lower rates usually work the other way. The effect is stronger for some sectors than others.
Can you predict what will move a stock?
You can know when big news is scheduled, like earnings or CPI, but not how the market will react. That's why traders size every trade so a surprise move stays a small, planned loss.
Want the next step? We'll walk you through it.
Four free lessons by email, one every few days — each with a 10-minute exercise on a real chart.
Send Me the Free Lessons 4 short emails · No spam · Unsubscribe anytimeOr see the whole method, step by step:
See What’s Inside the Course Try everything free first. Decide when you're ready. · Open the free chart tool (works in the TradingView phone app)One chart idea a day, in plain English. Follow along: