
Fibonacci vs support and resistance: math or chart levels?
Fibonacci lines come from a formula. Support and resistance come from places price actually turned around. Knowing which is which tells you how much weight to give each line.
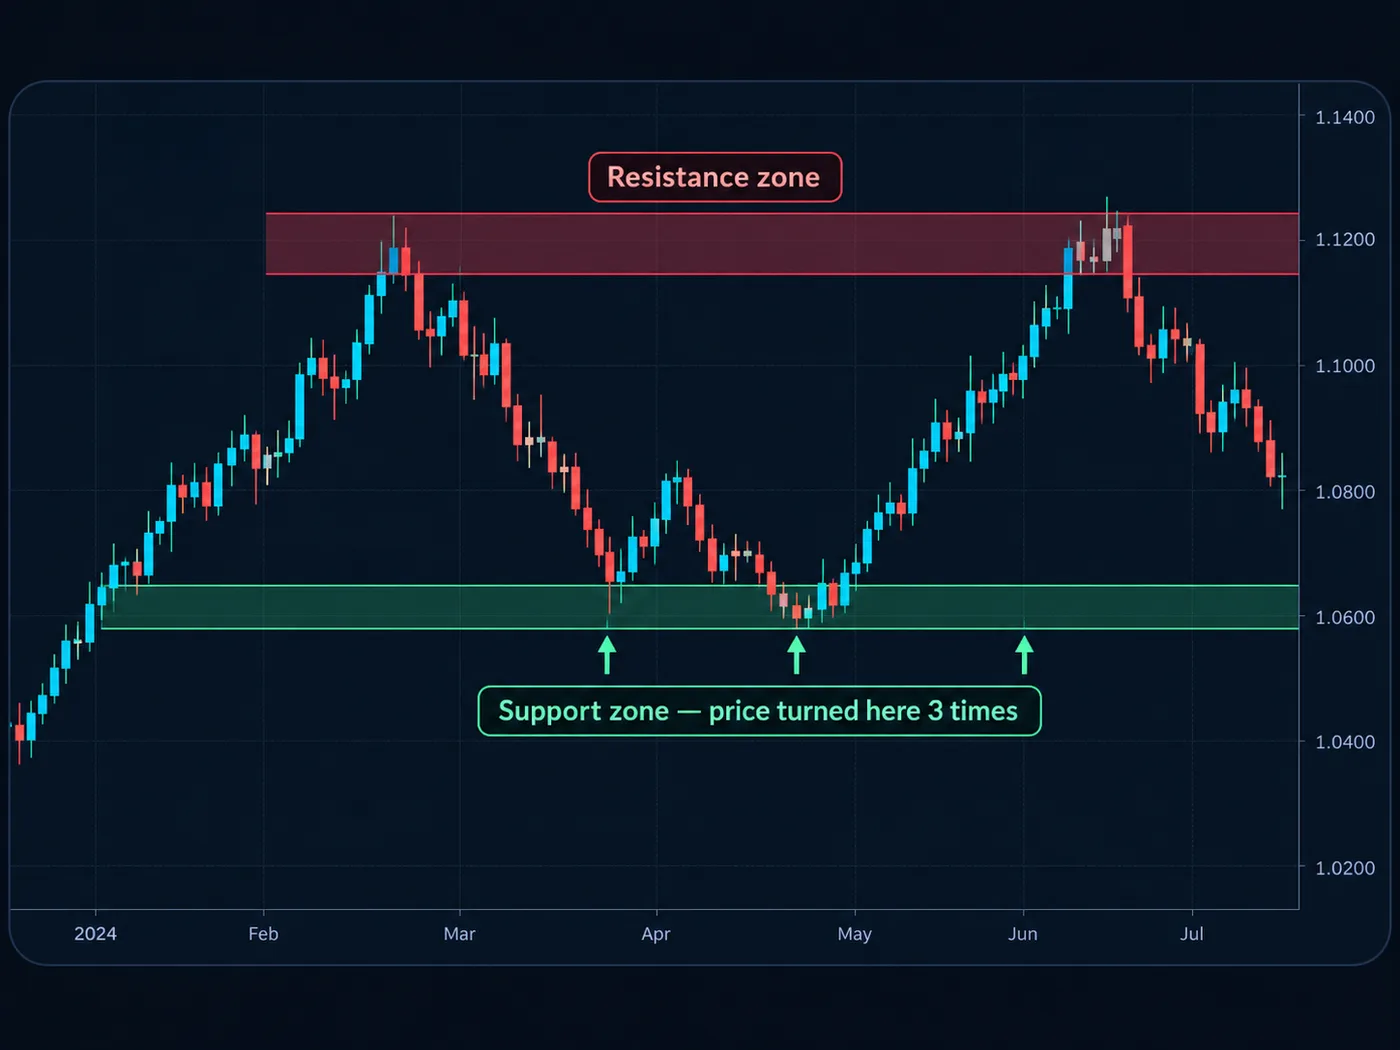
The short answer
Support and Resistance are prices where the market turned around before. Support is a floor where buyers stepped in. Resistance is a ceiling where sellers did. You find them by looking back at the chart.
A Fibonacci retracement is a set of lines drawn between one high and one low. The lines sit at fixed percentages of that move, most often 38.2%, 50% and 61.8%. You find them with a drawing tool and some math.
In plain words: support and resistance are where price did something. Fibonacci levels are where the math says to look.
Side by side
| Support and resistance | Fibonacci retracement | |
|---|---|---|
| Where it comes from | Past turning points on the chart | Fixed ratios of one move |
| What you need | Your eyes, or a tool that marks turns | One high, one low, a drawing tool |
| Common levels | Wherever price turned | 23.6%, 38.2%, 50%, 61.8%, 78.6% |
| Is it subjective? | Some: which turns count | Some: which high and low you pick |
| Works on any chart? | Yes | Yes, needs a clear move first |
| Best use | Mapping floors and ceilings | Gauging how deep a pullback is |
| Beginner first? | Yes, it's the base skill | Later, as a second opinion |
Where Fibonacci levels come from
The ratios come from the Fibonacci number series (1, 1, 2, 3, 5, 8, 13…). Divide a number by the one after it and you get close to 0.618. That's where 61.8% comes from.
Fun fact: the 50% line isn't a Fibonacci ratio at all. It's included because many traders watch the halfway point anyway.
A worked example
Say a stock rises from 100 to 120. That move is 20 points.
- 38.2% pullback: 20 × 0.382 = 7.64. The line sits near 112.36.
- 50% pullback: 10 points. The line sits at 110.
- 61.8% pullback: 20 × 0.618 = 12.36. The line sits near 107.64.
Now look left on the chart. Say price turned around at 110 twice last month. That's support.
110 is now a place where the math and the chart agree. That kind of overlap gets more attention than a Fibonacci line on empty chart space. See Fibonacci retracement explained.
Support and resistance: strengths and limits
The good parts:
- Real history. Each level is a place where buyers or sellers actually showed up.
- No math. You can see it on any chart, phone included.
- The base for everything else. Stops, targets and entries all start from these levels. See support and resistance.
The limits:
- Choosing which turns count. Beginners often draw too many lines.
- Levels break. A floor can give way. Only a candle body closing past a level counts as a real break in our method. Tails poking through don't.
Fibonacci: strengths and limits
The good parts:
- Fast. One drag of the tool gives a full set of lines.
- Measures pullback depth. It helps you describe whether a dip is shallow or deep.
- Widely watched. Many traders draw the same lines, so some reactions happen there.
The limits:
- Five lines cover a lot of price. Price will often react near one of them by chance. That can make Fibonacci look better than it is.
- Depends on your two points. Pick a different high or low and every line moves.
- No reason inside the math. A ratio doesn't know where real buyers are.
Start with the chart, then add the math. Mark the last places price turned around. Then, if you like, add Fibonacci and look for spots where a ratio lands on a real level. The real level is the anchor.
Which fits you?
- Brand new? Support and resistance first. It's the skill every other tool leans on.
- Trading pullbacks in a trend? Fibonacci can help you describe how deep the pullback is. See the pullback trading strategy.
- Want fewer lines? Keep only the Fibonacci levels that sit on a real past turn. Delete the rest.
The free StructureX chart tool marks those past turning points for you on TradingView, so the chart part is quick.
Common mistakes
- Drawing Fibonacci on every small wiggle. Use a clear, finished move on the bigger chart.
- Buying just because price hit 61.8%. A line is a place to watch, not a reason. Wait for the candle to show something.
- Moving the anchors until it "fits". If you redraw until past turns line up, the lines stop meaning anything.
- Forgetting the stop. Put it past the level that would prove you wrong, then size it with the position size calculator.
Questions
Is Fibonacci better than support and resistance?
Not as a starting point. Support and resistance come from where price really turned. Fibonacci comes from ratios. Many traders use Fibonacci only where it overlaps a real level.
Why is 61.8% important in Fibonacci?
It comes from the Fibonacci number series, where each number divided by the next is close to 0.618. Many traders watch it, which is part of why price sometimes reacts there.
Is the 50% level a Fibonacci level?
No. 50% isn't a Fibonacci ratio. It's included in most Fibonacci tools because the halfway point of a move is widely watched.
How do you combine Fibonacci with support and resistance?
Mark support and resistance first. Then draw Fibonacci on a clear move and look for ratios that land on those levels. Treat the overlap as a zone to watch, not a promise.
Want the next step? We'll walk you through it.
Four free lessons by email, one every few days — each with a 10-minute exercise on a real chart.
Send Me the Free Lessons 4 short emails · No spam · Unsubscribe anytimeOr see the whole method, step by step:
See What’s Inside the Course Try everything free first. Decide when you're ready. · Open the free chart tool (works in the TradingView phone app)One chart idea a day, in plain English. Follow along: