
Home › Guides › Reading charts
How to draw trendlines: 3 rules that keep them honest
A trendline is one of the oldest tools on a chart. It's also the easiest to bend to what you want to see. These 3 rules keep yours honest.
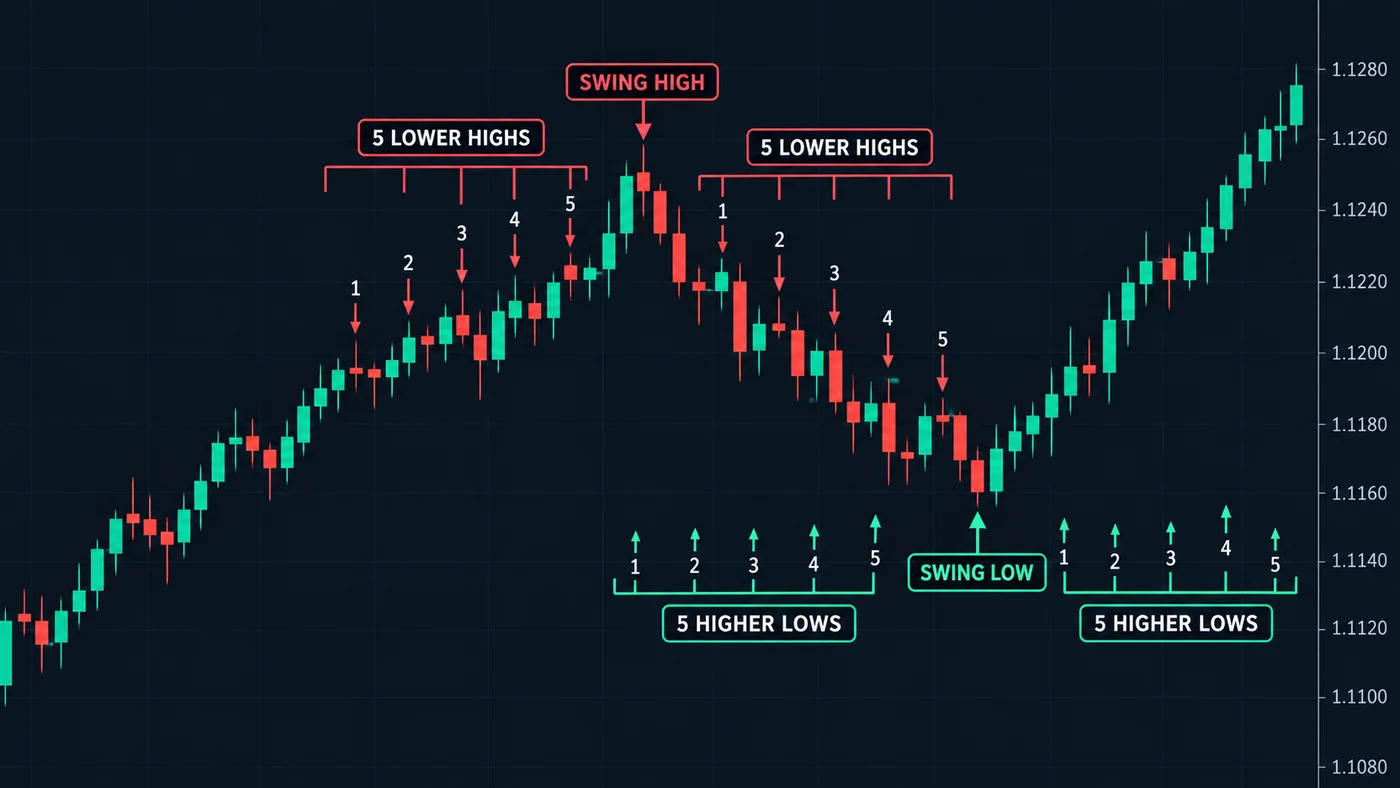
What a trendline is
A Trendline is a straight line that connects the turning points of a trend.
- In an uptrend, you connect the lows: the places price stopped falling and turned back up.
- In a downtrend, you connect the highs: the places price stopped rising and turned back down.
The line slopes. That's what makes it different from a flat Support or Resistance level. It's a floor (or ceiling) that rises (or falls) over time.
Turning points come first
Before you draw anything, find the turning points. These are the last places price clearly turned around.
An uptrend is higher highs and higher lows. Each low sits above the one before it. A trendline is just a straight line through those rising lows. See higher highs and higher lows.
So the trendline doesn't find the trend. The turning points do. The line only makes it easier to see.
The 3 rules
Rule 1: Start with 2 clear turning points
Two points make a line. But they must be real turning points: places where price clearly turned, with space between them.
Don't connect two candles next to each other. Don't connect a turning point to a random wick in the middle of a move.
Rule 2: Pick wicks or bodies, and stick with it
You can draw through the wicks (the thin tails) or the bodies (the thick part). Both are common.
What matters is that you choose one way and use it every time. Switching on each chart lets you draw whatever line you want to see.
Rule 3: A third touch earns trust
Two points always make a line. That's geometry, not proof.
When price comes back to the line a third time and turns again, now the line has shown something. Until then, it's a guess.
If you have to move the line to make the third touch "fit", it didn't fit. Leave the old line, or delete it.
A simple example
Say a stock makes these lows over a few weeks:
- $50, then $54, then $58
Each low is $4 higher than the last, about one week apart. Connect $50 and $54 and the line rises about $4 a week. Extend it, and it points near $58 a week later.
Price comes down to about $58 and turns up. That's the third touch. The line has earned some trust.
Now say price later falls to $60 when the line sits at $66. The line is broken. But is the trend over?
Not by itself. Read on.
A trendline break isn't a trend change
Here's the part most guides skip.
A trendline is drawn by you. A break of it means price stopped rising as fast as before. It can still be making higher lows, just at a gentler slope.
The trend only changes when the turning points change. In an uptrend, that means a candle body closing below the last higher low. Wicks poking through don't count. See how to identify a trend.
The line is your drawing. The turning points are the market's. When they disagree, believe the turning points.
In the example above, the last higher low was $58. A drop to $60 broke the line but stayed above $58. The trend of higher lows is still intact. A body close below $58 would be the real change.
What trendlines can't do
- They can't predict. They connect past turning points. Price doesn't have to respect them.
- They're easy to bend. On a finished chart, you can always find a line that "worked". That's hindsight, not skill.
- They depend on your scale. On long-term charts, a log scale and a normal scale can give different lines. On TradingView you can switch scales in the bottom-right corner.
- Steep lines break fast. The steeper the line, the sooner price falls below it, even in a healthy trend.
Common mistakes
- Forcing a line. Cutting through candle bodies to make it touch a third point.
- Too many lines. Five trendlines on one chart, all meaning something different. Keep 1 or 2.
- Treating any break as a reversal. Check the turning points first.
- Drawing on tiny timeframes only. Lines from the daily chart matter more than lines from a 1-minute chart. Check the bigger chart first.
- Mixing wicks and bodies. Pick one. Stick with it.
Try it today on TradingView
About 10 minutes.
- Open a daily chart with a clear uptrend.
- Mark the last 3–4 turning-point lows by eye. Are they each higher than the last?
- Pick the Trend Line tool from the left toolbar (on a computer, the shortcut is Alt + T, or Option + T on a Mac).
- Connect the first 2 lows. Use wicks or bodies, not both.
- Extend it. Did price touch it a third time? If the line breaks later, check: did a body also close below the last higher low?
Our free chart tool marks the turning points for you, so you start from the real points, not from a guess. Add it on TradingView. New to the app? See how to use TradingView.
Questions
How do you draw a trendline correctly?
In an uptrend, connect two clear turning-point lows; in a downtrend, two clear highs. Choose wicks or bodies and use that every time. Trust the line more after a third touch.
Should trendlines be drawn on wicks or bodies?
Both are common. What matters is being consistent, so you can't bend the line to fit what you want to see.
How many touches make a valid trendline?
Two points make a line, but a third touch where price turns again is what gives it some weight.
Does a trendline break mean the trend is over?
Not on its own. It means price slowed down. The trend changes when the turning points change, such as a candle body closing below the last higher low in an uptrend.
Is a trendline the same as support and resistance?
They're cousins. Support and resistance are flat areas where price turned before; a trendline is a sloped line through a trend's turning points.
Want the next step? We'll walk you through it.
Four free lessons by email, one every few days — each with a 10-minute exercise on a real chart.
Send Me the Free Lessons 4 short emails · No spam · Unsubscribe anytimeOr see the whole method, step by step:
See What’s Inside the Course Try everything free first. Decide when you're ready. · Open the free chart tool (works in the TradingView phone app)One chart idea a day, in plain English. Follow along: