
Indicators vs price action: read the chart or the lines?
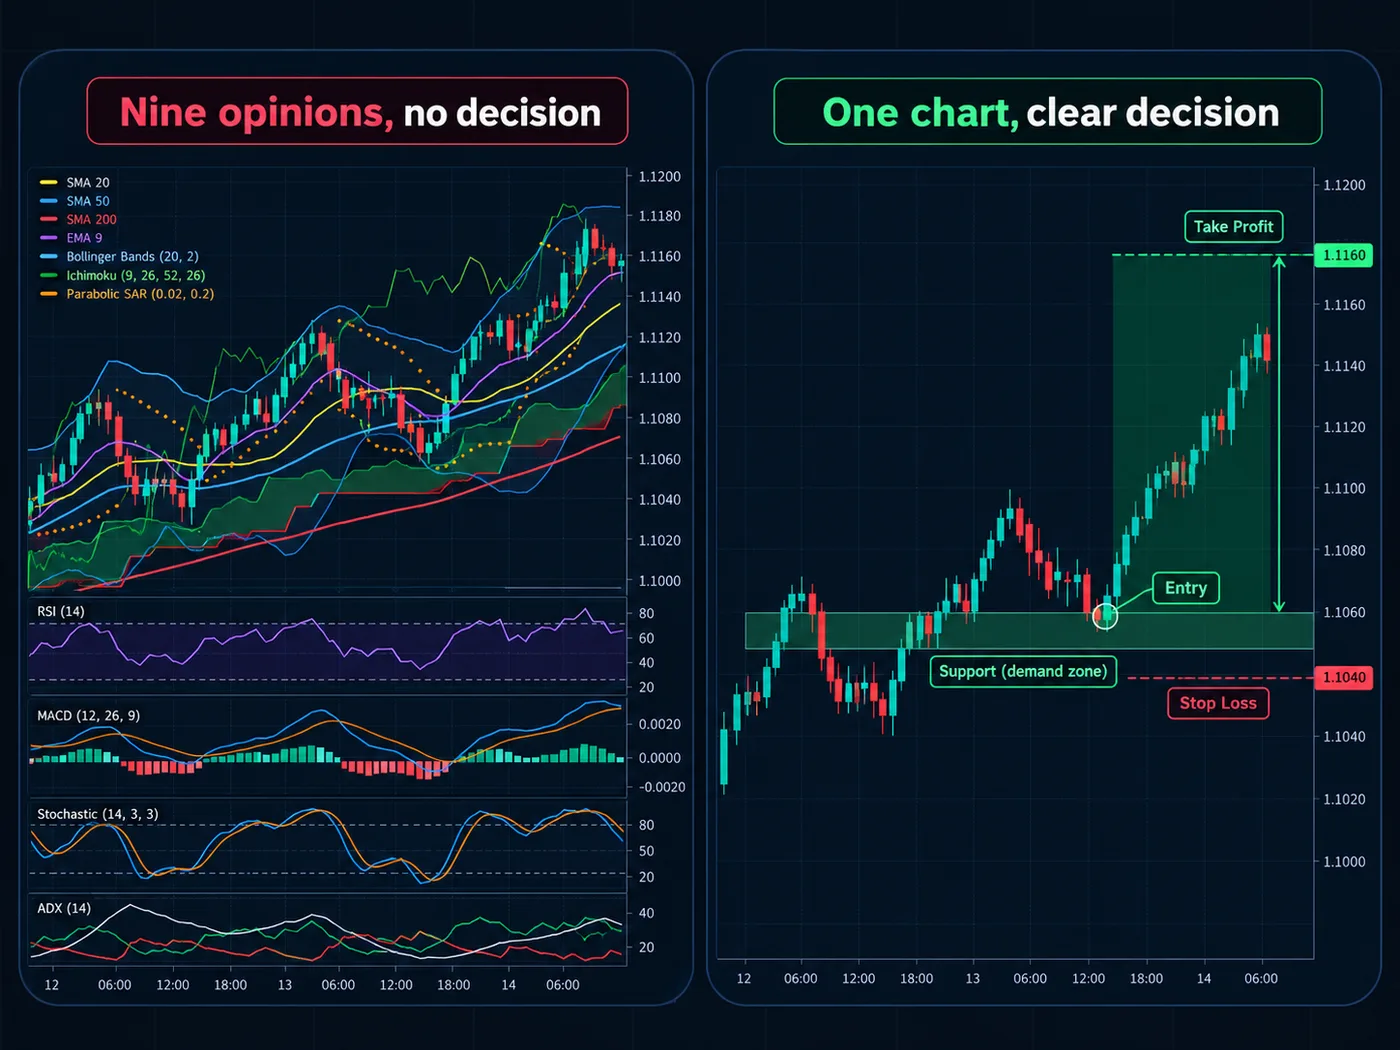
Every indicator is built from the same candles you can already see. So why add lines at all? Sometimes they help. Often they just add noise.
The short answer
Price action means reading the chart itself: candles, turning points, trends and levels. No extra lines needed.
Indicators are lines calculated from price, and sometimes volume. Moving averages, RSI and MACD are common ones. They summarize what price did, in a different shape.
Price action is the source. Indicators are summaries of the source.
Side by side
| Price action | Indicators | |
|---|---|---|
| What you read | Candles, turning points, levels, trend | Lines and numbers calculated from price |
| Speed | Shows what's happening now | Built on past bars, so they lag |
| Gives exact levels | Yes, real highs and lows | Not usually |
| Easy to start with | Takes practice to see | Easy, a line crossing is simple |
| Risk of clutter | Low | High, it's easy to stack five |
| Subjective? | Somewhat, two people may mark levels differently | Less, the math is fixed |
| Works on any market | Yes | Yes, though volume-based ones need good data |
Price action, in plain words
Reading price action means answering a few questions straight from the candles:
- Where did price turn around? Those turning points become levels. See support and resistance.
- What's the trend? Higher highs and higher lows, or lower highs and lower lows.
- Did a candle body close past the level? A tail poke doesn't count.
From those answers come your entry, your stop past the last turning point, and your target.
Indicators, in plain words
Each indicator takes price and reshapes it:
- Moving averages smooth price into a line. See moving averages explained.
- RSI and the stochastic score how strong recent moves were on a 0 to 100 scale.
- MACD shows the gap between two averages.
Because they're calculated from bars that already closed, they always trail price a little.
Price action: strengths and limits
The good parts:
- No lag beyond the candle itself. You see the move as it forms.
- Exact levels for stops and entries.
- One skill for every market and timeframe.
The limits:
- Takes practice. At first, a bare chart can look like noise.
- Judgment calls. Which turning points count? Clear rules help a lot.
Indicators: strengths and limits
The good parts:
- Simple rules. "Above the line" or "below 30" is easy to test.
- A second opinion. A trend filter like a 200-day average can stop you from fighting the bigger move.
- Consistent. The same math gives the same answer every time.
The limits:
- Lag. Signals often come after the move has started.
- Clutter. Several indicators from the same prices mostly repeat each other.
- No levels. Most can't tell you where your stop belongs.
There's a middle path. Some tools are indicators that draw price action. They mark the turning points and trend automatically, so the levels are consistent. The free StructureX chart tool on TradingView does this, and it works in the TradingView phone app too.
Which fits you?
- You want exact levels and a clean chart. Lean on price action. Start with turning points and the body-close rule.
- You want simple, testable rules. One or two indicators can work, as long as you pair them with levels and a stop.
- Your chart has four or more indicators. Try removing all but one for a week of practice. Notice what you actually used.
A common setup: price action for the plan, plus one indicator as a filter. See how to read candlestick charts.
Common mistakes
- Stacking indicators for "confirmation". Lines built from the same prices agree with each other, so it isn't real confirmation.
- Waiting for every line to line up. By then, the move is often done.
- Marking every wiggle as a level. Keep only the clear turning points. Fewer lines, clearer decisions.
- Changing indicators after a few losses. Judge a method over many trades. See how to backtest a trading strategy.
Questions
Is price action better than indicators?
Neither is better for everyone. Price action gives exact levels with no lag but takes practice. Indicators are simpler to read but lag behind price. Many traders combine them.
Do professional traders use indicators?
Some do, and many also read price directly. Common choices are a moving average or VWAP as a reference, alongside levels from the chart.
How many indicators should I use?
Fewer than you'd think. One or two that measure different things is plenty. More lines mostly repeat the same information.
What is price action trading?
It means making trading decisions from the candles themselves: where price turned around, which way the trend runs, and whether a candle body closed past a level.
Want the next step? We'll walk you through it.
Four free lessons by email, one every few days — each with a 10-minute exercise on a real chart.
Send Me the Free Lessons 4 short emails · No spam · Unsubscribe anytimeOr see the whole method, step by step:
See What’s Inside the Course Try everything free first. Decide when you're ready. · Open the free chart tool (works in the TradingView phone app)One chart idea a day, in plain English. Follow along: