
Uptrend vs downtrend: how to read the staircase
A trend is just a staircase. Up a step, back a little, up again. Learn to read the steps, and you'll know which way the chart is leaning before you do anything else.
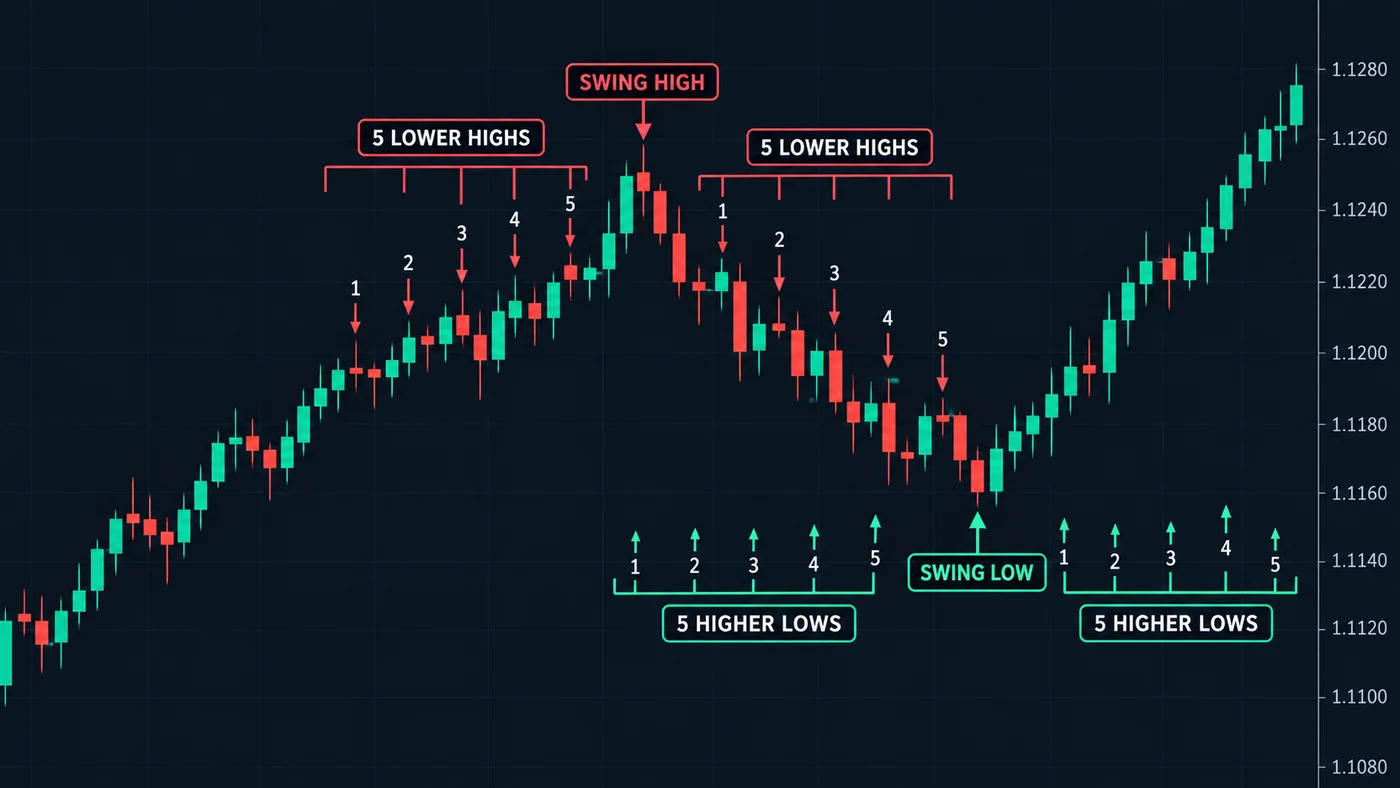
The short answer
An uptrend makes higher highs and higher lows. Each push up goes further than the last one, and each dip stops above the last dip.
A downtrend makes lower highs and lower lows. Each drop goes further, and each bounce stops below the last bounce.
If neither pattern is clear, the market is moving sideways.
Side by side
| Uptrend | Downtrend | |
|---|---|---|
| The highs | Each one higher | Each one lower |
| The lows | Each one higher | Each one lower |
| The dips (pullbacks) | Down moves, buyers return | Up moves, sellers return |
| Where many look for a trade | Near a higher low | Near a lower high |
| Where a stop often goes | Below the last higher low | Above the last lower high |
| A warning sign | A body closes below the last higher low | A body closes above the last lower high |
| Trend tools that fit | Buys with the trend | Sells with the trend |
A worked example
Here's an uptrend in numbers. The turning points, in order:
- Low at 100
- High at 110
- Low at 104 (higher than 100)
- High at 116 (higher than 110)
- Low at 109 (higher than 104)
Every high beats the last high. Every low stays above the last low. That's the staircase going up.
Now a downtrend:
- High at 120
- Low at 112
- High at 117 (lower than 120)
- Low at 106 (lower than 112)
- High at 111 (lower than 117)
Same shape, flipped. See higher highs and higher lows.
Reading an uptrend
What helps:
- Dips are your friend. A Pullback toward the last higher low gives a planned place to buy, with a clear stop below it.
- Waiting brings clarity. Waiting for the dip is easier than chasing a green candle.
What to watch:
- The last higher low. If a candle body closes below it, the staircase has broken. In our example, that's a close below 109.
- Shrinking pushes. When each new high only beats the last by a little, the trend may be tiring.
Reading a downtrend
What helps:
- Bounces are the plan. A rally into the last lower high is where sellers have shown up before.
- Floors break more easily. Buying every "cheap" price fights the staircase.
What to watch:
- The last lower high. A body close above it, 111 in our example, is the first sign the down staircase is breaking.
- A higher low after that. One close isn't a new uptrend. A higher low that holds is the next clue.
Check the bigger chart first. The 5-minute chart can be in an uptrend while the daily is falling. Many traders read the daily or 4-hour trend first, then trade only in that direction on the smaller chart. See multiple timeframe analysis.
Which fits you?
You don't choose the trend. The chart does. Your job is to match it:
- Clear uptrend on the bigger chart: look for buys near higher lows.
- Clear downtrend: look for sells near lower highs, if your market and account allow selling short. See Long and short.
- No clear staircase: wait, or use range rules. Sitting out is a real choice.
Our free StructureX chart tool on TradingView marks the turning points, so the staircase is easier to see.
Common mistakes
- Calling a trend from two points. One higher high isn't a trend. Wait for the high and the low to both step.
- Using wicks to judge a break. A poke below the last low that closes back above isn't a break. Wait for the body close.
- Fighting the trend because price "looks too high". High prices can go higher in an uptrend.
- Moving the stop when the trend wobbles. Set it below the last higher low, size from it with the position size calculator, and leave it.
Questions
How do you know if a stock is in an uptrend or downtrend?
Mark the last few places price turned around. Higher highs and higher lows mean an uptrend. Lower highs and lower lows mean a downtrend. If it's mixed, the market is moving sideways.
What ends an uptrend?
A common first sign is a candle body closing below the last higher low. That breaks the staircase. A lower high after that adds more evidence that the trend has changed.
Can a market be in an uptrend and downtrend at the same time?
Yes, on different charts. The hourly chart can be falling inside a daily uptrend. That's why many traders check the bigger chart first and trade in its direction.
Is a pullback the start of a downtrend?
Not by itself. A dip that stops above the last low is a normal part of an uptrend. It only becomes a warning if a body closes below that last low.
Want the next step? We'll walk you through it.
Four free lessons by email, one every few days — each with a 10-minute exercise on a real chart.
Send Me the Free Lessons 4 short emails · No spam · Unsubscribe anytimeOr see the whole method, step by step:
See What’s Inside the Course Try everything free first. Decide when you're ready. · Open the free chart tool (works in the TradingView phone app)One chart idea a day, in plain English. Follow along: