
Is the trend over when price dips? How to tell a pullback from a turn
Price is rising, then it drops for three red candles. It feels like the end. Usually it's a pause. Trends move like stairs, not escalators, and there's one level that tells you which is which.
The myth
Red candles after a run of green ones look alarming. Especially on a short chart, a dip can fill the whole screen. It's easy to think the move has turned.
That's what charts look like close up. The explanation that's usually missing is how trends are built in the first place.
What's actually true
Trends move in steps
An uptrend is a series of higher highs and higher lows. Price rises, pulls back a bit, then rises past the last high. Each pullback is a step. A Pullback isn't the trend ending. It's part of how the trend is made.
Example: price rises from 100 to 110, dips to 105, rises to 116, dips to 111, rises to 122. Every dip ended higher than the one before (105, then 111). Three dips, and the trend never broke. Someone selling at every dip would have exited 3 times inside one uptrend.
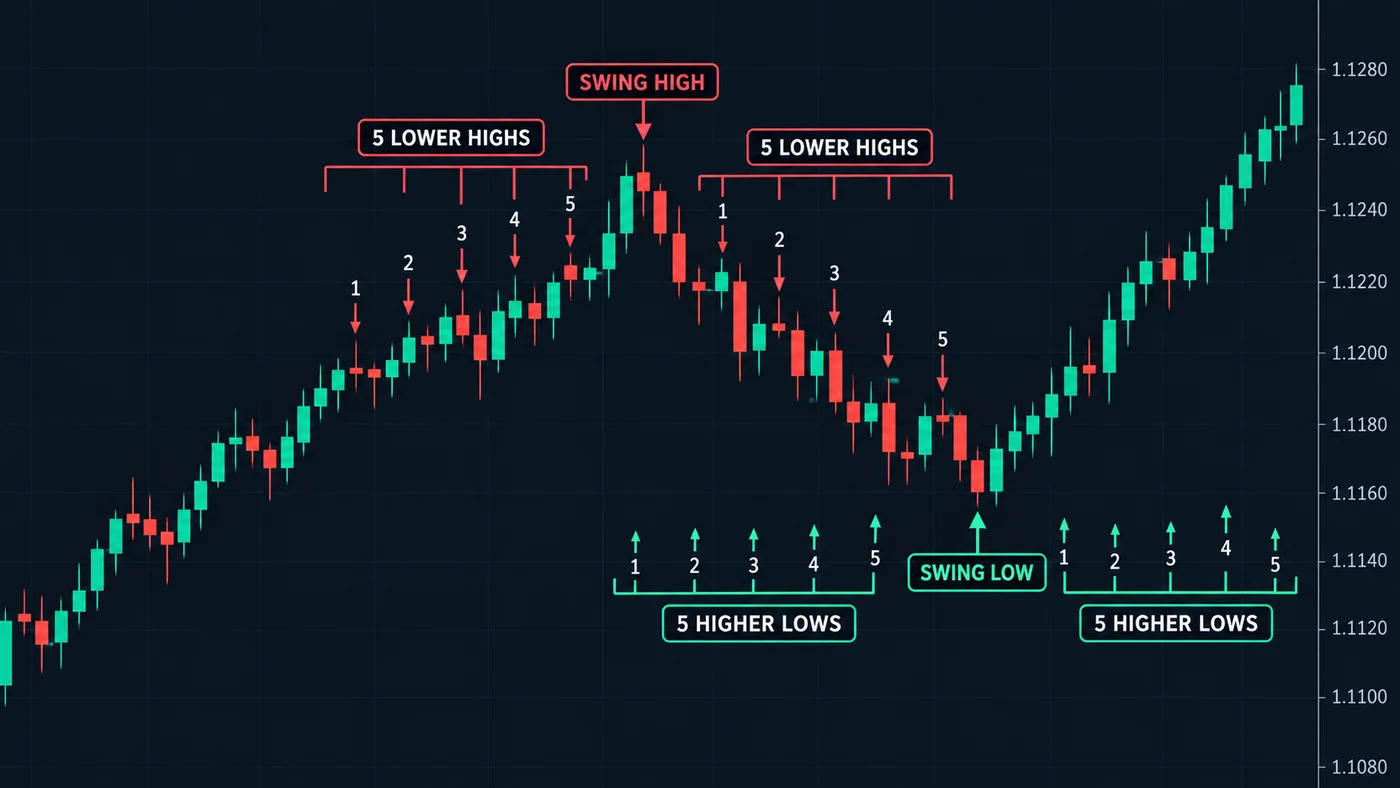
The one level that matters: the last higher low
In our method, an uptrend is intact while price stays above its last higher low, the most recent place price turned back up. The test is the same one we use everywhere: did a candle body close below that low? A wick poking under doesn't count.
- Dip that holds above the last higher low: still a pullback.
- Body closes below the last higher low: the trend's structure has changed. Traders call this a change of character. See change of character.
For a downtrend, flip it: the key level is the last lower high.
The bigger chart decides
A drop on a 5-minute chart may be a tiny pullback on the daily chart. Check the bigger chart first. If it's still making higher highs and higher lows, a small-chart dip is most likely noise. See multiple timeframe analysis.
Trends do end
Honesty matters here too. Every trend ends eventually. The point isn't that dips are always safe. It's that you need a clear rule for when the trend is over, instead of a feeling.
What to do instead
- Mark the last higher low on the chart you trade. That's your line.
- Check the bigger chart's trend before reacting.
- Wait for a body close past the line before calling a turn.
- Use pullbacks as a plan, not a panic. Many trend traders look to buy near the end of a pullback, with a stop below the last higher low. See the pullback trading strategy.
- Size from that stop with the position size calculator, so if the trend does end, the loss is your planned 1%.
Our free StructureX chart tool marks these last turning points automatically on TradingView, which makes the "last higher low" easy to spot.
Common follow-up mistakes
- Moving the stop up to every tiny low. Normal pullbacks will knock you out. Use the clear turning points.
- Calling the top on a wick. A long tail under the low isn't a body close.
- Reading a 1-minute chart against a daily trend. Small charts disagree with big ones all the time.
- Refusing to accept a real break. When the body closes below the last higher low, the plan says the trend has changed. Respect it.
Try it today: open a daily chart of any big stock in an uptrend. Mark each higher low. Count how many dips held above the previous low before one finally didn't.
Questions
How do you know if a pullback is a reversal?
Watch the last higher low (in an uptrend). If a candle body closes below it, the trend's structure has changed. If the dip holds above it, it's still a pullback by that rule.
How deep can a pullback go?
There's no fixed amount. Some are shallow, some retrace much of the last move. What matters is whether price holds above the last higher low.
What is a higher low?
It's a turning point where price dipped and turned back up at a level above the previous dip. A series of higher lows, along with higher highs, defines an uptrend. See higher highs and higher lows.
Should I sell when a stock dips?
That should depend on your plan, not the dip. If your stop is below the last higher low and price is above it, the plan says the idea is still valid.
Want the next step? We'll walk you through it.
Four free lessons by email, one every few days — each with a 10-minute exercise on a real chart.
Send Me the Free Lessons 4 short emails · No spam · Unsubscribe anytimeOr see the whole method, step by step:
See What’s Inside the Course Try everything free first. Decide when you're ready. · Open the free chart tool (works in the TradingView phone app)One chart idea a day, in plain English. Follow along: