
AUD/JPY explained: the pair traders use as a mood gauge
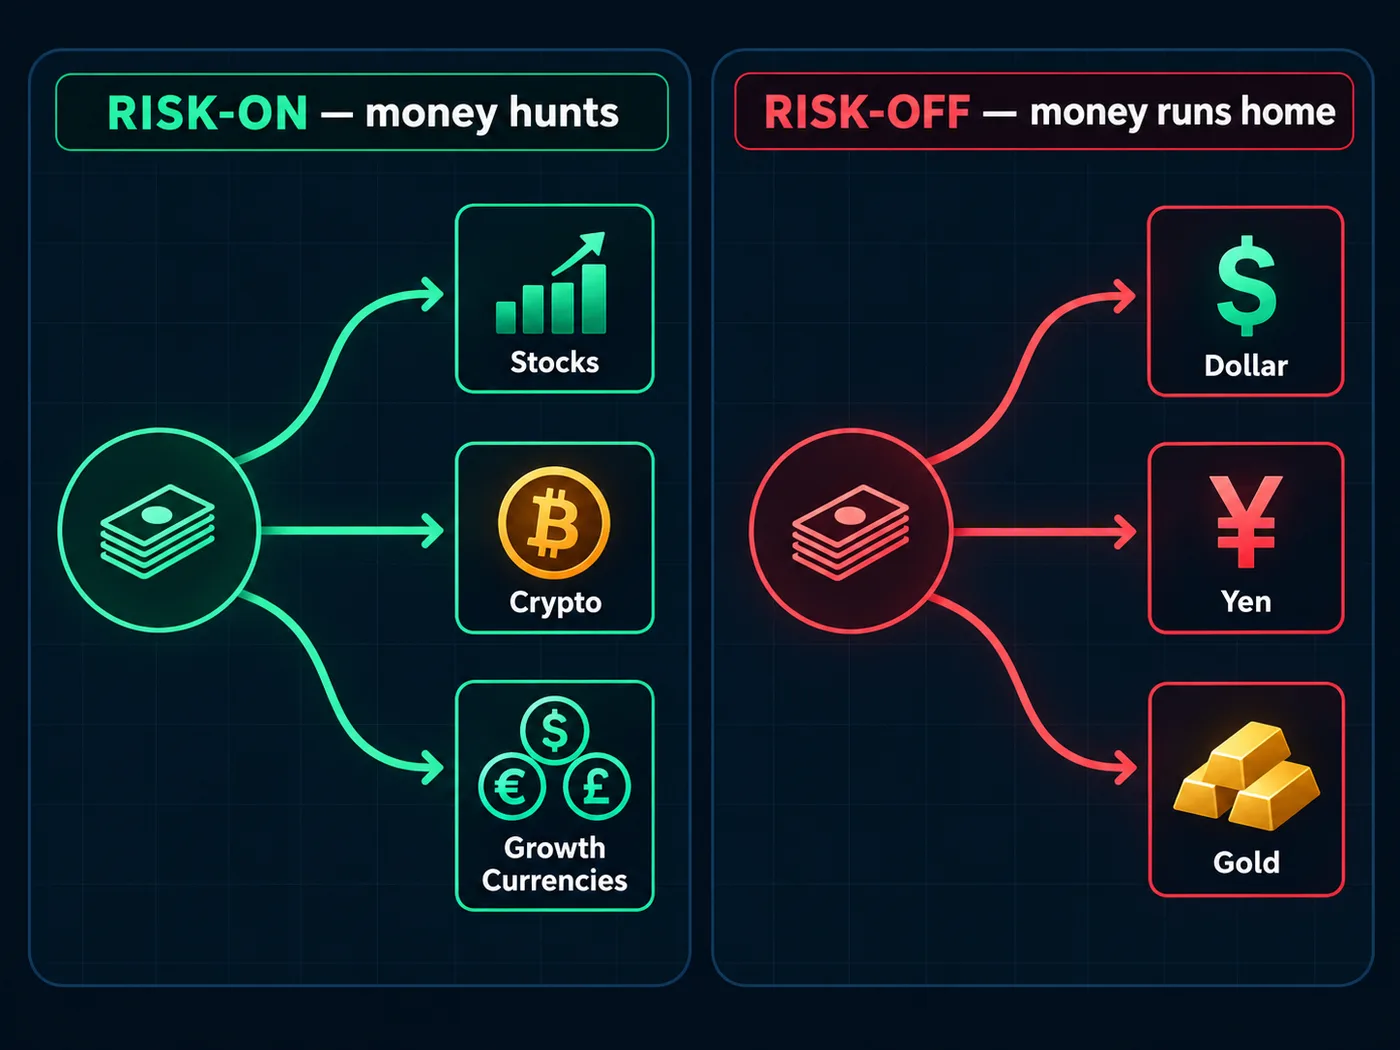
Put a growth currency against a safe-haven currency and you get a chart of the market's mood. That's AUD/JPY.
At a glance
| AUD/JPY | |
|---|---|
| What it is | How many Japanese yen one Australian dollar buys |
| Pip size | 0.01 |
| One pip is worth | ¥1,000 per standard lot. In US dollars it depends on USD/JPY |
| Busiest hours (ET) | Asian session, about 7 pm – 3 am, then the US morning |
| What moves it most | Risk mood, the RBA, the Bank of Japan, China, metals |
| Trading hours | Sunday ~5 pm ET to Friday 5 pm ET |
Pip math, as an example. ¥1,000 per standard lot is about $6.67 if USD/JPY were at 150. A math example, not a forecast. The pip value calculator converts at today's rate.
Why it's called a mood gauge
The Aussie tends to do well when the world feels confident: growth, trade, metals demand. The yen tends to do well when the world is worried. Put them in one pair and the chart often rises in calm, "risk-on" times and falls in "risk-off" scares.
That's why many traders glance at AUD/JPY to see how nervous markets are. It's a gauge, not a crystal ball.
What moves it
- Risk mood. Big stock market swings, global scares, sudden headlines.
- The RBA. 8 meetings a year, decided at 2:30 pm Sydney time (around 10:30 pm–12:30 am ET).
- The Bank of Japan. 8 meetings a year, usually announced in the US late evening.
- The rate gap. Australian rates have long been above Japan's. In calm times traders borrow yen to hold Aussie dollars, a "carry trade". When fear hits, they rush out together. That's part of why yen pairs fell sharply in early August 2024.
- China and iron ore, through the Australian side.
When it's busiest
Both home markets are in Asia. Sydney opens around 5 pm ET and Tokyo around 7 pm ET, so for US traders this is mostly an evening pair. Australian, Chinese and Japanese news all land in that window. It can pick up again in the US morning if US stocks are moving.
Japan has no daylight saving, and Australia's clocks move opposite to the US. Session times in ET can shift by up to two hours across the year. Our market hours tool keeps up.
Its personality
- Climbs slowly, falls fast. Calm periods can bring long, gentle rises. Fear can erase them in days.
- Tracks stocks on many days. Not always, but often enough to notice.
- News in your evening. The big releases arrive while the US is winding down.
Fear moves are fast for people too. When AUD/JPY drops hard, it's easy to jump in late. Our guide to trading psychology has a simple pause to use first.
Reading it with our method
- Weekly and daily first. Mark the last places price turned around. Long calm climbs show up clearly there.
- Trade with that direction on a smaller chart.
- Body close only. In risk-off bursts, tails can stretch far past levels.
- Size from the stop with the lot size calculator, using the pip value in dollars. Keep risk near 1%.
Common mistakes
- Treating it as a stock index. It often moves with stocks, but not always. Read its own chart.
- Assuming the climb is steady forever. Carry-trade climbs can end abruptly.
- Holding open through Asian news you didn't check, like the RBA or BoJ.
- Doubling up with AUD/USD or other yen crosses: often the same idea twice.
Questions
Why is AUD/JPY a risk sentiment indicator?
It pairs a currency that tends to rise when markets feel confident (the Aussie) with one that tends to rise when they're worried (the yen). So the pair often moves with the market's mood.
What is the carry trade in AUD/JPY?
Borrowing in yen, where rates are low, to hold Australian dollars, where rates are higher. It can lift the pair slowly in calm times and unwind fast in a scare.
What time is AUD/JPY most active?
Usually the Asian session, roughly 7 pm to 3 am ET, when Sydney and Tokyo are both open.
How much is a pip on AUD/JPY?
¥1,000 per standard lot. In dollars that's ¥1,000 divided by the USD/JPY price.
Want the next step? We'll walk you through it.
Four free lessons by email, one every few days — each with a 10-minute exercise on a real chart.
Send Me the Free Lessons 4 short emails · No spam · Unsubscribe anytimeOr see the whole method, step by step:
See What’s Inside the Course Try everything free first. Decide when you're ready. · Open the free chart tool (works in the TradingView phone app)One chart idea a day, in plain English. Follow along: