
USD/JPY explained: how US yields and the yen move together
USD/JPY often looks like a chart of US interest rates. Learn why, and the pair makes a lot more sense.
At a glance
| USD/JPY | |
|---|---|
| What it is | How many Japanese yen one US dollar buys |
| Pip size | 0.01 (the 2nd decimal, because the yen is a small unit) |
| One pip is worth | ¥1,000 per standard lot. In dollars it depends on the price |
| Busiest hours (ET) | Tokyo, about 7 pm – 4 am, and again 8 am – noon |
| What moves it most | US bond yields, the Fed, the Bank of Japan, Japan stepping in |
| Trading hours | Sunday ~5 pm ET to Friday 5 pm ET |
Pip math, as an example. One pip on a standard lot is ¥1,000. If USD/JPY were at 150, that's ¥1,000 ÷ 150 ≈ $6.67. At 140 it would be about $7.14. A math example, not a forecast. The pip value calculator does this at any price.
What moves it
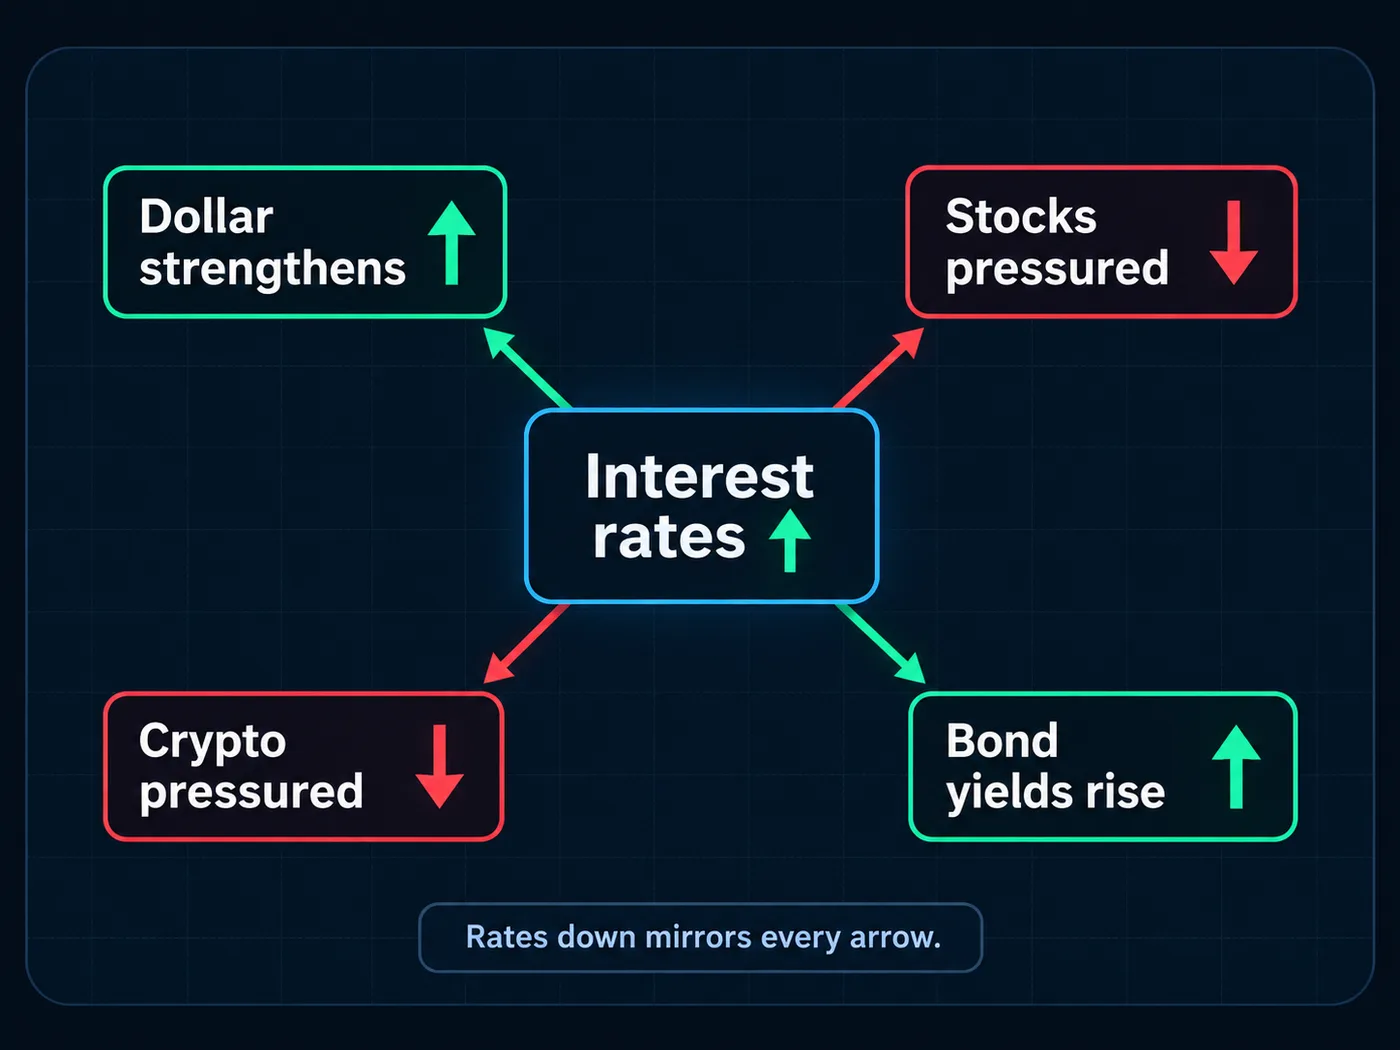
- US bond yields. When US 10-year yields rise, the dollar often gets stronger against the yen. When they fall, it often weakens. Not always, but often enough to watch.
- The Fed. Anything that changes the US rate outlook, like CPI at 8:30 am ET or a Fed decision at 2:00 pm ET.
- The Bank of Japan (BoJ). It meets 8 times a year. It kept rates below zero for years, then ended that in March 2024. Any hint of more rate rises can lift the yen. Its decisions have no fixed time but usually land in the Tokyo morning, which is late evening ET.
- Japan's finance ministry. When the yen weakens too fast, Japan can buy yen to push it back up. It did this in 2022 and 2024. Those moves can be large and sudden.
- Risk mood. In a scare, money often runs to the yen, which can push USD/JPY down.
Listen for warnings. Before Japan steps in, officials often say they're "watching the market with urgency." When those words show up, sudden drops are more likely.
When it's busiest
Unlike most dollar pairs, USD/JPY has two busy times. It's active in the Tokyo session, roughly 7 pm to 4 am ET. Then it picks up again with the US morning, 8 am to noon ET. Japan doesn't use daylight saving, so Tokyo hours slide an hour in ET when US clocks change.
Its personality
- Trends that last. Because the rate gap between the US and Japan changes slowly, USD/JPY can trend for months.
- Sharp falls. When a long trend reverses, it can drop fast. In August 2024 the yen jumped as many traders rushed out of trades that borrowed cheap yen.
- Round numbers matter. Levels like 150 or 160 get a lot of attention, partly because of past action by Japan.
Reading it with our method
- Mark the turning points on the daily chart. Is it making higher highs and higher lows? That's your direction.
- Check yields on the side. Not as a signal. Just know whether the rate story agrees with your chart.
- Body close only. Past a level with a full candle body, not a tail.
- Size from the stop in pips, using a pip value worked out in dollars, not the $10 you'd use on EUR/USD. The lot size calculator handles it.
Common mistakes
- Using $10 a pip. That's only true for pairs ending in USD. Here the pip is in yen, so the dollar value is smaller, and it changes with price.
- Counting the wrong decimal. A pip is 0.01 here, not 0.0001. Many brokers show a third decimal; that's a tenth of a pip.
- Ignoring official warnings. A big trend can end in minutes when Japan steps in.
- Holding into the BoJ. It lands while most US traders are asleep.
Questions
Why does USD/JPY follow US Treasury yields?
Money tends to flow toward higher rates. When US yields rise and Japan's stay low, holding dollars pays more than holding yen, which often lifts USD/JPY.
How much is 1 pip on USD/JPY?
¥1,000 per standard lot. In dollars it's ¥1,000 divided by the price, so about $6.67 at 150 (a math example).
What is yen intervention?
Japan's government, through the finance ministry, buys yen in the market to slow a fast fall. It did so in 2022 and 2024.
Is the yen a safe haven?
Often, yes. In a market scare, money tends to move into the yen, so USD/JPY can fall when stocks drop.
Want the next step? We'll walk you through it.
Four free lessons by email, one every few days — each with a 10-minute exercise on a real chart.
Send Me the Free Lessons 4 short emails · No spam · Unsubscribe anytimeOr see the whole method, step by step:
See What’s Inside the Course Try everything free first. Decide when you're ready. · Open the free chart tool (works in the TradingView phone app)One chart idea a day, in plain English. Follow along: