
Support vs resistance: floor, ceiling, and the flip
Support is where price has stopped falling before. Resistance is where it has stopped rising. The interesting part is what happens when one of them breaks.
The short answer
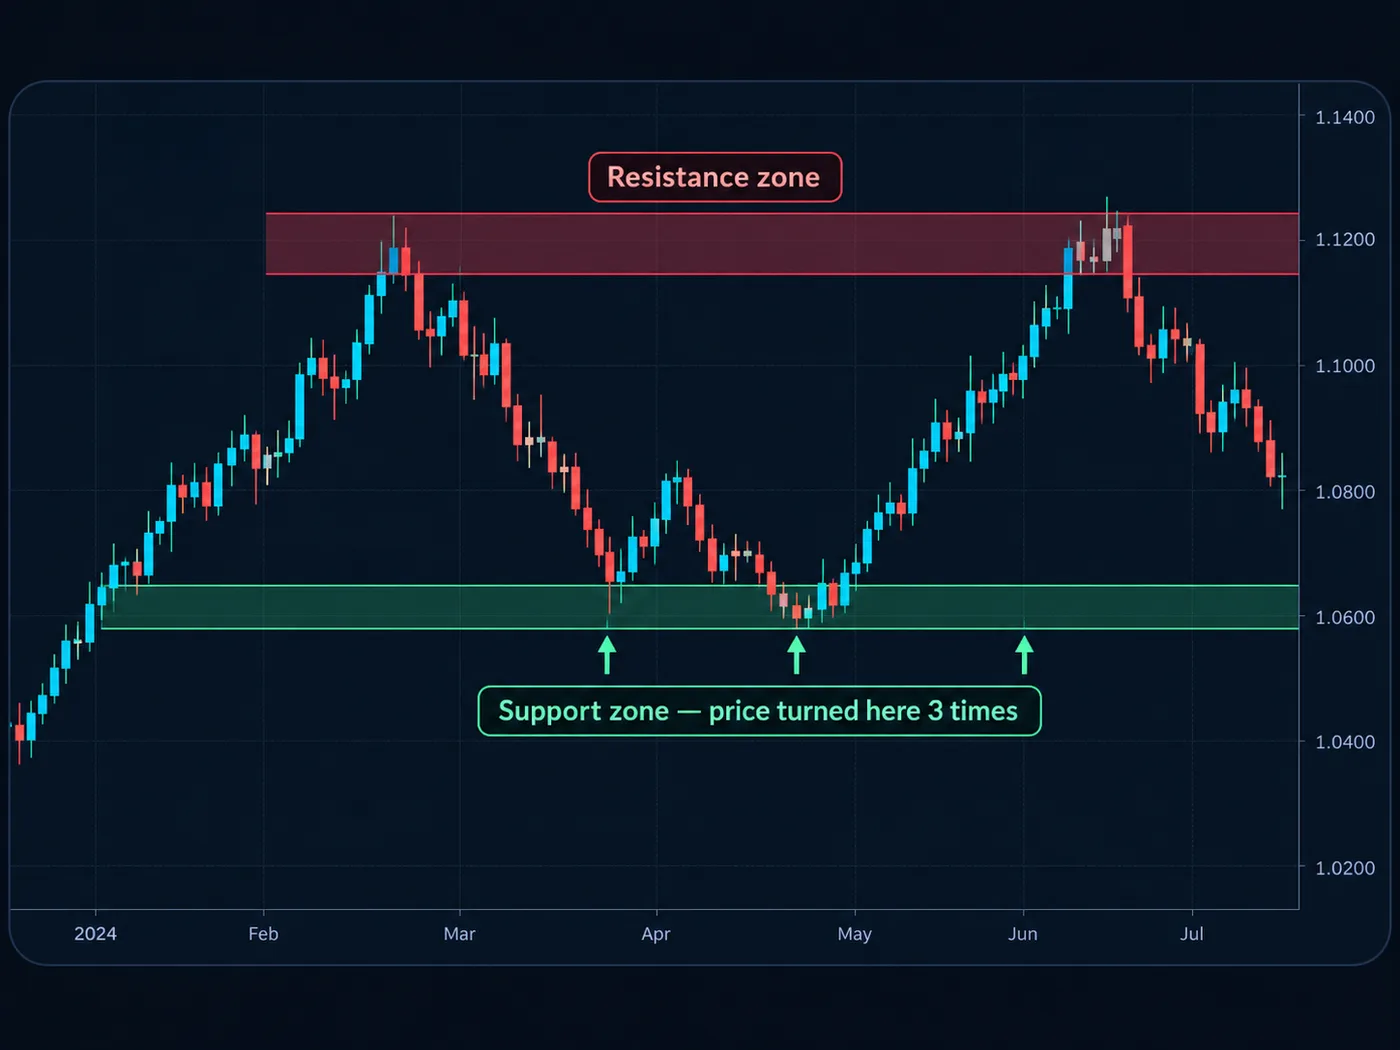
Support is a price area below the current price where buyers stepped in before and price turned up. Think of a floor.
Resistance is a price area above the current price where sellers stepped in before and price turned down. Think of a ceiling.
They're the same idea pointed in two directions. And when price breaks through one, it often becomes the other.
Side by side
| Support | Resistance | |
|---|---|---|
| Where it sits | Below current price | Above current price |
| What happened there before | Price stopped falling and turned up | Price stopped rising and turned down |
| Who showed up | Buyers | Sellers |
| A "break" means | A body closes below it | A body closes above it |
| After a real break | Often acts as resistance | Often acts as support |
| Where a stop often goes | Just below it (for a buy) | Just above it (for a sell) |
| Common trap | Buying every touch in a downtrend | Selling every touch in an uptrend |
How to mark them
- Zoom out to a bigger chart, like the daily.
- Find the last few places price clearly turned around. Those are your turning points.
- Draw a line or a thin zone through the bodies of the candles there, not the tips of the wicks.
- Below price: support. Above price: resistance.
- Keep two or three on each side. More than that turns the chart into noise.
Our free StructureX chart tool on TradingView marks these turning points for you, and it works in the TradingView phone app too.
Support: strengths and limits
Why it helps:
- A clear place to plan a buy. You know where you'd be wrong: a close below the floor.
- A clear stop. Just past the level, so the stop has a reason.
Where it fails:
- In a downtrend. Floors keep breaking when lower highs and lower lows are stacking up.
- After many touches. Each test can use up the buyers who were waiting there.
Resistance: strengths and limits
Why it helps:
- A natural target. If you bought at support, resistance is a sensible place to plan your exit.
- A clear place to plan a sell in a downtrend.
Where it fails:
- In an uptrend. Ceilings keep breaking when higher highs and higher lows are stacking up.
- Round numbers fool people. $100 isn't resistance just because it's round. It needs a real turn there.
The flip: when support becomes resistance
Say a stock bounced off $50 three times. Then a daily candle body closes at $48.20. The floor has broken.
Later, price rallies back to $50 and stalls. The old floor is now acting as a ceiling. Traders call this a Retest.
Only a body close counts. A wick that pokes below $50 and snaps back is not a break. It's a test that held. Waiting for the candle to close is what separates a real break from a fakeout. See breakout vs fakeout.
Which fits you?
You don't pick one. You use both, and the trend decides which one you act on:
- Uptrend: focus on buys near support, with resistance as the target.
- Downtrend: focus on sells near resistance, with support as the target.
- Sideways: both edges matter. See range trading explained.
Not sure which you're in? See how to identify a trend.
Common mistakes
- Drawing ten lines. If every price is a level, none of them is.
- Using wick tips. Bodies show where price actually settled.
- Trading against the bigger trend. A floor on the 5-minute chart means little in a falling daily chart.
- Stop right on the line. Put it just past the level, then size from that distance with the position size calculator.
Questions
What is the difference between support and resistance?
Support is a price area below the market where price stopped falling and turned up before. Resistance is an area above the market where price stopped rising and turned down. One acts like a floor, the other like a ceiling.
Why does support become resistance?
Traders remember the level. Some who bought there are now holding a loss and sell when price returns to it, and others see it as a place to sell. That selling can turn the old floor into a ceiling.
How many times can support be tested?
There's no fixed number. Each test can use up the buyers waiting there, so a level touched many times can be weaker, not stronger. Watch how price closes each time.
Is support and resistance a line or a zone?
It's usually more useful as a thin zone. Price rarely turns at the exact same cent. A zone drawn through the candle bodies at past turning points is more realistic.
Want the next step? We'll walk you through it.
Four free lessons by email, one every few days — each with a 10-minute exercise on a real chart.
Send Me the Free Lessons 4 short emails · No spam · Unsubscribe anytimeOr see the whole method, step by step:
See What’s Inside the Course Try everything free first. Decide when you're ready. · Open the free chart tool (works in the TradingView phone app)One chart idea a day, in plain English. Follow along: