
Home › Guides › Chart patterns
Range trading explained: how to read a sideways market
Most guides teach you to follow the trend. But a lot of the time, there isn't one. Price just bounces between a floor and a ceiling. That's a range, and it has its own rules.
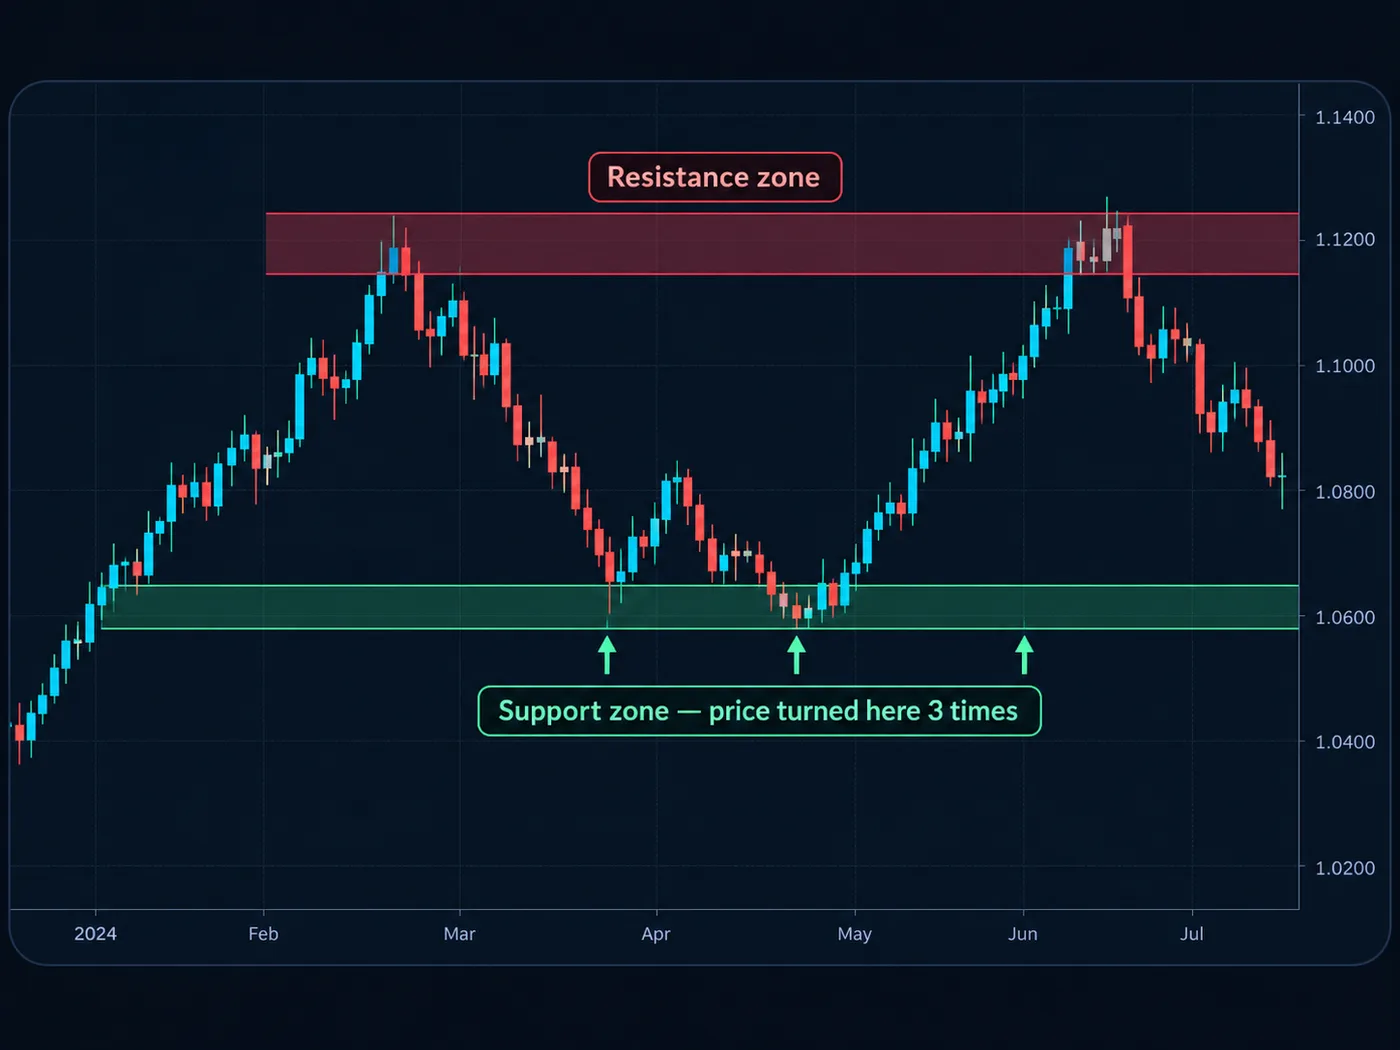
What a range is
A range is a market moving sideways.
Price rises to a ceiling and turns down. It falls to a floor and turns up. Then it does it again. It isn't making higher highs and higher lows, and it isn't making lower lows and lower highs. It's just bouncing.
- The ceiling is Resistance: where sellers keep showing up.
- The floor is Support: where buyers keep showing up.
- The middle is everything in between.
How to spot one
- Look at the turning points. Mark the last few places price turned around. In a trend, they step up or down. In a range, they sit at about the same heights.
- Count the touches. At least 2 clear turns at the top and 2 at the bottom. One touch each side is just a pullback.
- Draw zones, not lines. Shade the small area at the top and the bottom. Price rarely turns at the exact same price twice.
If you can't tell whether it's trending, that's an answer too. A messy, unclear chart is a fine reason to wait. See how to identify a trend.
The middle is a no-trade zone
Here's the most useful rule on this page.
In a range, the decisions happen at the edges. The middle is where trades have the worst math.
Why? Say you buy in the middle. Your stop has to go below the floor, which is far away. Your target is the ceiling, which is close. You risk a lot to make a little.
At the floor, it flips. The stop is close (just below the floor). The target is far (the ceiling). That's the whole idea of range trading.
Two ways to approach a range
1. Trade the edges
Buy near the floor, sell near the ceiling. You're betting the range holds.
- Wait for price to reach an edge. Don't jump in on the way there.
- Look for a sign it's turning: a candle with a long tail rejecting the edge, or a body closing back inside after a poke.
- Stop just past the edge. Target the other side, or the middle if you want to be careful.
2. Wait for the break
Do nothing inside the range. Wait for price to leave it.
- A candle body must close outside the range. A Wick poking out doesn't count.
- After a break up, the old ceiling can become the new floor. Price often comes back to test it.
- This is a Breakout trade. See breakout vs fakeout.
Pick one approach in your plan. Switching mid-trade is how a careful idea turns into a guess.
The pokes at the edges
Ranges are full of fake breaks.
Price pokes just past the ceiling, triggers the buy orders of people trading the break and the Stop loss orders of people who sold, then snaps back inside. That's a Fakeout. Some traders call it a sweep. See liquidity sweeps explained.
This is good news if you trade the edges. A poke and a quick close back inside is often a clearer turn signal than a plain touch. It's bad news if you buy every poke. The body-close rule filters many of them out.
Where a stop would logically go
- Buying at the floor: just below the floor zone, plus a little room for pokes.
- Selling at the ceiling: just above the ceiling zone, plus a little room.
- Trading a break up: below the old ceiling, or below the last low before the break.
How much room is "a little"? Look at how far past the edge the past pokes went. Your stop goes past those, not inside them.
A worked example
An illustration, not a real trade.
A currency pair on a 1-hour chart has bounced between 1.2500 (floor) and 1.2600 (ceiling) for 2 weeks. Past pokes went about 10 Pips past each edge.
Price drops to 1.2510. A candle pokes to 1.2495, then closes at 1.2515, back above the floor.
Account 10,000 units, 1% risk = 100 units.
- Entry 1.2515. Stop 1.2480, past the past pokes. Risk = 35 pips.
- Target 1.2590, just under the ceiling. Reward = 75 pips.
- Risk-reward is about 1 to 2.1.
Now compare buying in the middle at 1.2550, with the same stop area: risk 70 pips, reward 40. About 1 to 0.6. Same range, much worse math.
Check yours with the risk-reward calculator and size it with the position size calculator. A math example, not a promise. Ranges break, and the trade can lose.
When a range ends
Every range ends. Signs it may be close:
- The touches get weaker. Price stops reaching the floor, making higher lows inside the range. Buyers are getting eager.
- The range gets tight. The swings shrink. Something like a triangle is forming.
- Big news is coming. Ranges often form before a big data release, then break on it. Check the calendar. See how to read an economic calendar.
When a body closes outside and the next candles stay out, stop trading the edges.
Common mistakes
- Trading the middle. The math is worst there.
- Calling a range too soon. One touch at each side is a pullback, not a range.
- Exact-line thinking. Expecting a turn at one perfect number. Use zones.
- Stops inside the poke area. A stop exactly at the edge gets hit by normal pokes.
- Fading a real break. Selling the ceiling again after a body close above it, because "it always turned here before."
Try it today on TradingView
About 15 minutes.
- Open a 1-hour chart and start Bar Replay a few weeks back.
- Step forward until you see 2 touches at the top and 2 at the bottom. Shade both zones.
- Measure how far the pokes went past each edge.
- Plan one edge trade: entry, stop past the pokes, target. Work out the risk-reward.
- Step forward. Did it hold or break? Log it.
Questions
What is range trading?
Trading a market that moves sideways between a floor and a ceiling. You either buy near the floor and sell near the ceiling, or wait for price to close outside the range and trade the break.
How do you know if a market is ranging?
Its turning points stop stepping up or down and sit at about the same heights. Look for at least 2 clear turns at the top and 2 at the bottom.
Where should the stop go in a range trade?
Just past the edge you're trading from, with room for the pokes you've seen before. Not exactly at the edge.
Is range trading good for beginners?
It's a clear way to learn about levels, stops and risk-reward. The hard parts are waiting for the edges and accepting that every range ends. Practice it on past charts first.
Want the next step? We'll walk you through it.
Four free lessons by email, one every few days — each with a 10-minute exercise on a real chart.
Send Me the Free Lessons 4 short emails · No spam · Unsubscribe anytimeOr see the whole method, step by step:
See What’s Inside the Course Try everything free first. Decide when you're ready. · Open the free chart tool (works in the TradingView phone app)One chart idea a day, in plain English. Follow along: