
Do indicators predict the future? What they really show
A line that turns green before price goes up looks like a crystal ball. It isn't. Every indicator is built from prices that already happened, and that's actually useful once you know it.
The myth
You open a chart. Under it sits a wavy line with buy and sell arrows. Every arrow in the past seems to land right before a big move.
It's easy to see why people believe it. Most videos only show the arrows that worked. And a past chart always looks obvious, because you already know what happened next.
So the myth isn't silly. It comes from how indicators get shown, not from the person watching.
What's actually true
An indicator is a formula. It takes past prices, does some math, and draws the answer.
Take the RSI. By default it looks at the last 14 candles. It compares the size of the up moves to the size of the down moves, and squeezes the result into a number from 0 to 100. That's all. It doesn't know about tomorrow. Nothing can.
A Moving average is even simpler:
Example: a 5-day average of closes at 10, 11, 12, 13 and 14 is (10+11+12+13+14) ÷ 5 = 12. If tomorrow closes at 9, the average drops to (11+12+13+14+9) ÷ 5 = 11.8. The average moved after price did. It always will.
This is why traders call most indicators lagging. They summarise. They don't forecast.
Why the arrows look so good
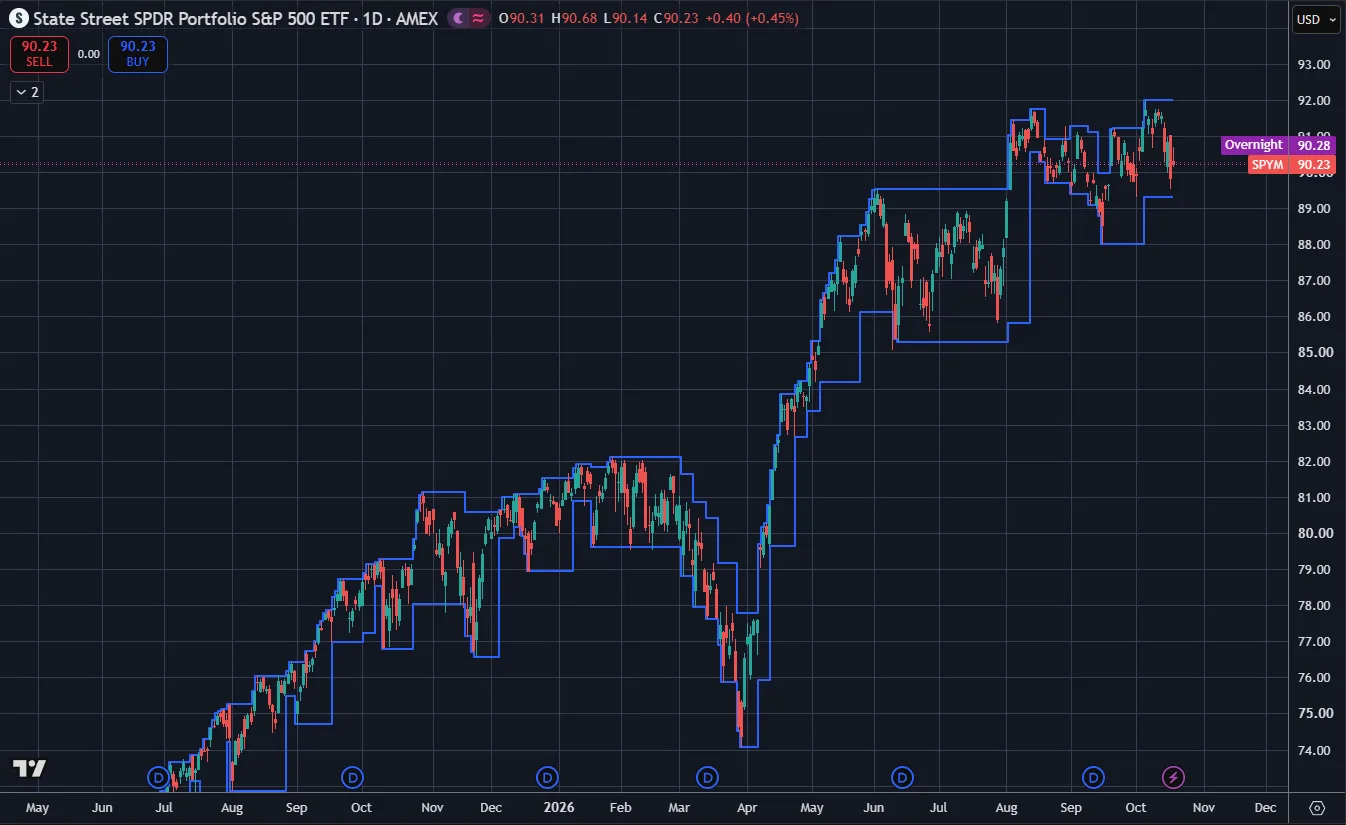
Some tools redraw. A signal that appears on a live candle can move or vanish once the candle closes. On a past chart you only see the final version. That can make a tool look far better than it felt live. Our bar replay guide shows how to check a tool candle by candle.
What indicators ARE good for
Used honestly, a good indicator saves you work. It can:
- Describe the trend at a glance. Is price above or below its average?
- Measure how fast or wild price is moving. The ATR tells you a normal day's range, which helps you set a sensible stop.
- Mark things you'd mark by hand. Our free StructureX chart tool marks the last places price turned around, so you don't have to hunt for them. It describes the chart. It doesn't predict it.
The shift is small but it matters. Stop asking "what will happen?" Start asking "what is the chart showing right now?"
What to do instead
- Read price first. Is it making higher highs and higher lows, or lower ones? Our trend guide shows how.
- Pick one indicator with one job. Write the job down: "the ATR tells me my stop distance."
- Test it on past charts. Use replay, never peek ahead, and log every signal, good and bad. See how to backtest a strategy.
- Plan the loss before the entry. Any signal can be wrong. Decide your stop, then size from it with the position size calculator.
Common follow-up mistakes
- Trading the arrow, ignoring the chart. A buy signal right under a ceiling is still a buy into a ceiling.
- Swapping indicators after 3 losses. Three trades tell you almost nothing. Every method has losing runs.
- Stacking 4 indicators to "confirm." Most are built from the same closes, so they agree with each other, not with the future. More in the more-indicators myth.
- Tweaking settings until the past looks perfect. That fits the tool to old noise. It rarely holds up later.
Quick check: cover the right half of a chart. Ask the indicator what happens next. Then uncover it. Do this 20 times and count. It's the fastest way to see what a tool can and can't do.
Questions
Are there any indicators that predict price?
No indicator knows the future. Some leading tools, like oscillators, try to show when a move is slowing, but they're still built from past prices and are often early or wrong. Treat every signal as a maybe, with a stop.
Is price action better than indicators?
Neither is magic. Reading price directly keeps the chart clean; indicators can summarise it faster. Many traders use price first and one indicator as a helper. See indicators vs price action.
What does it mean when an indicator repaints?
It means past signals can change after the fact, usually because the tool used a candle that hadn't closed yet. On a finished chart, it looks perfect. Live, it doesn't. Checking with bar replay is the easiest test.
Why do indicators lag?
Because they average or compare past prices. Price moves first and the math catches up. That lag is the cost of a smoother, clearer line.
Want the next step? We'll walk you through it.
Four free lessons by email, one every few days — each with a 10-minute exercise on a real chart.
Send Me the Free Lessons 4 short emails · No spam · Unsubscribe anytimeOr see the whole method, step by step:
See What’s Inside the Course Try everything free first. Decide when you're ready. · Open the free chart tool (works in the TradingView phone app)One chart idea a day, in plain English. Follow along: