
More indicators, better trades? Why 6 can show less than 1
When one indicator feels unsure, adding a second seems smart. Then a third. Soon the chart is a rainbow. Here's why more lines often show less, and what a clean chart looks like.
The myth
The idea sounds logical. One witness can be wrong. Five witnesses who agree are more convincing.
So people add RSI, then MACD, then a stochastic, then two Moving averages. Plenty of online setups show a chart with six tools on it, all "lining up." It looks thorough. The explanation just skips one detail.
What's actually true
Most indicators are made from the same thing
RSI uses closing prices. MACD uses closing prices. The stochastic uses closes, highs and lows. Moving averages use closes.
So when they agree, it's not five witnesses. It's one witness telling the same story five times. Statisticians call this overlap correlation. If price rose hard for 5 candles, almost every momentum tool will say "up" at once.
Example: price climbs from 100 to 110 in 5 candles. RSI goes over 70. The stochastic goes over 80. MACD crosses up. Price is above both averages. That's 5 "agreements." But they all describe one fact: price went up 10 in 5 candles. You learned nothing new after the first one.
More tools means more mixed signals
When the tools do disagree, you now have to pick which one to believe. That choice tends to get made by feeling, after the fact. More lines also means more chances to find some reason to take a trade you already wanted.
Extra lines hide the price
Every indicator takes screen space. On a phone, six tools can squeeze the price candles into a thin strip. The thing all of them are built from becomes the hardest thing to see.
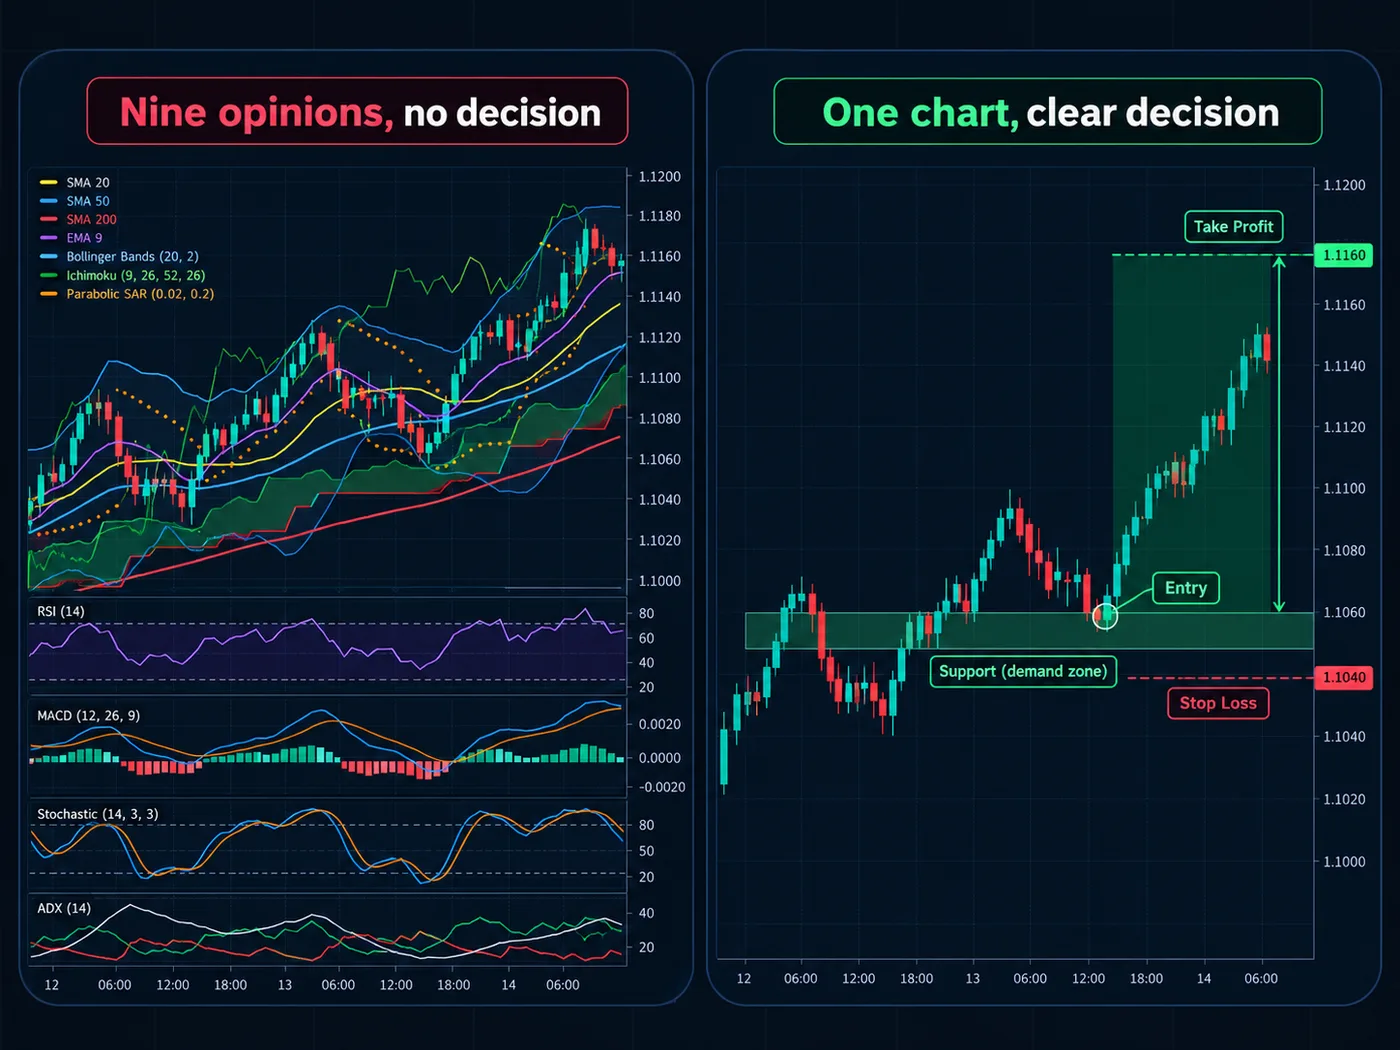
What real confirmation looks like
If you want two views that don't just echo, pick ones built from different information:
- Location: is price at a level where it turned before? See support and resistance.
- Direction: what's the bigger chart's trend? See multiple timeframe analysis.
- Behaviour: did a candle body close past the level, or just a wick?
- Calendar: is a big report due? That isn't on the chart at all.
That's Confluence that actually adds something.
What to do instead
- Strip the chart bare. Candles only. Look at it for 2 minutes.
- Mark 3 or 4 zones where price clearly turned.
- Add back one tool, with one written job. For example, "ATR sets how much room my stop gets."
- Test that one tool on 50 past trades with replay. Log whether it helped.
- Only add a second tool if it measures something different. Volume is different from price. A second momentum tool usually isn't. See RSI vs stochastic.
Our free StructureX chart tool was built for this idea: it marks the last places price turned around and stays out of the way, so the chart stays clean.
Common follow-up mistakes
- Going from 6 tools to 0 and then 6 again after a few losses. The losses weren't caused by the tool count. Every method has losing runs.
- Waiting for every tool to agree. By the time they all do, the move is often mostly over.
- Using defaults you don't understand. If you can't say what a tool measures in one sentence, it's not helping.
Quick test: for each tool on your chart, finish this sentence: "This tells me ___ that the candles don't." If you can't, remove it.
Questions
How many indicators should I use?
Many traders use zero to two. What matters more is that each one has a clear job and measures something the others don't. Price, levels and the bigger trend come first.
Is it bad to use RSI and MACD together?
Not bad, but they're both momentum tools built from closing prices, so they often say the same thing. Using one and spending the attention on levels and the bigger chart usually gives more information.
What is the best indicator combination?
There isn't a magic combination. A useful pair measures different things, like a trend tool plus volume, or price levels plus volatility. Test any combination on past charts before trusting it.
Why does my chart give conflicting signals?
Tools with different settings react at different speeds. One sees the last 9 candles, another the last 26. Fewer tools, each with a written job, makes conflicts rarer and easier to settle.
Want the next step? We'll walk you through it.
Four free lessons by email, one every few days — each with a 10-minute exercise on a real chart.
Send Me the Free Lessons 4 short emails · No spam · Unsubscribe anytimeOr see the whole method, step by step:
See What’s Inside the Course Try everything free first. Decide when you're ready. · Open the free chart tool (works in the TradingView phone app)One chart idea a day, in plain English. Follow along: