
Home › Guides › Candlestick patterns
Marubozu candlestick: the no-tail candle, explained
A marubozu is a candle that's all body and no tails. One side was in charge from the first second to the last. That's a strong message, and it can mean two very different things.
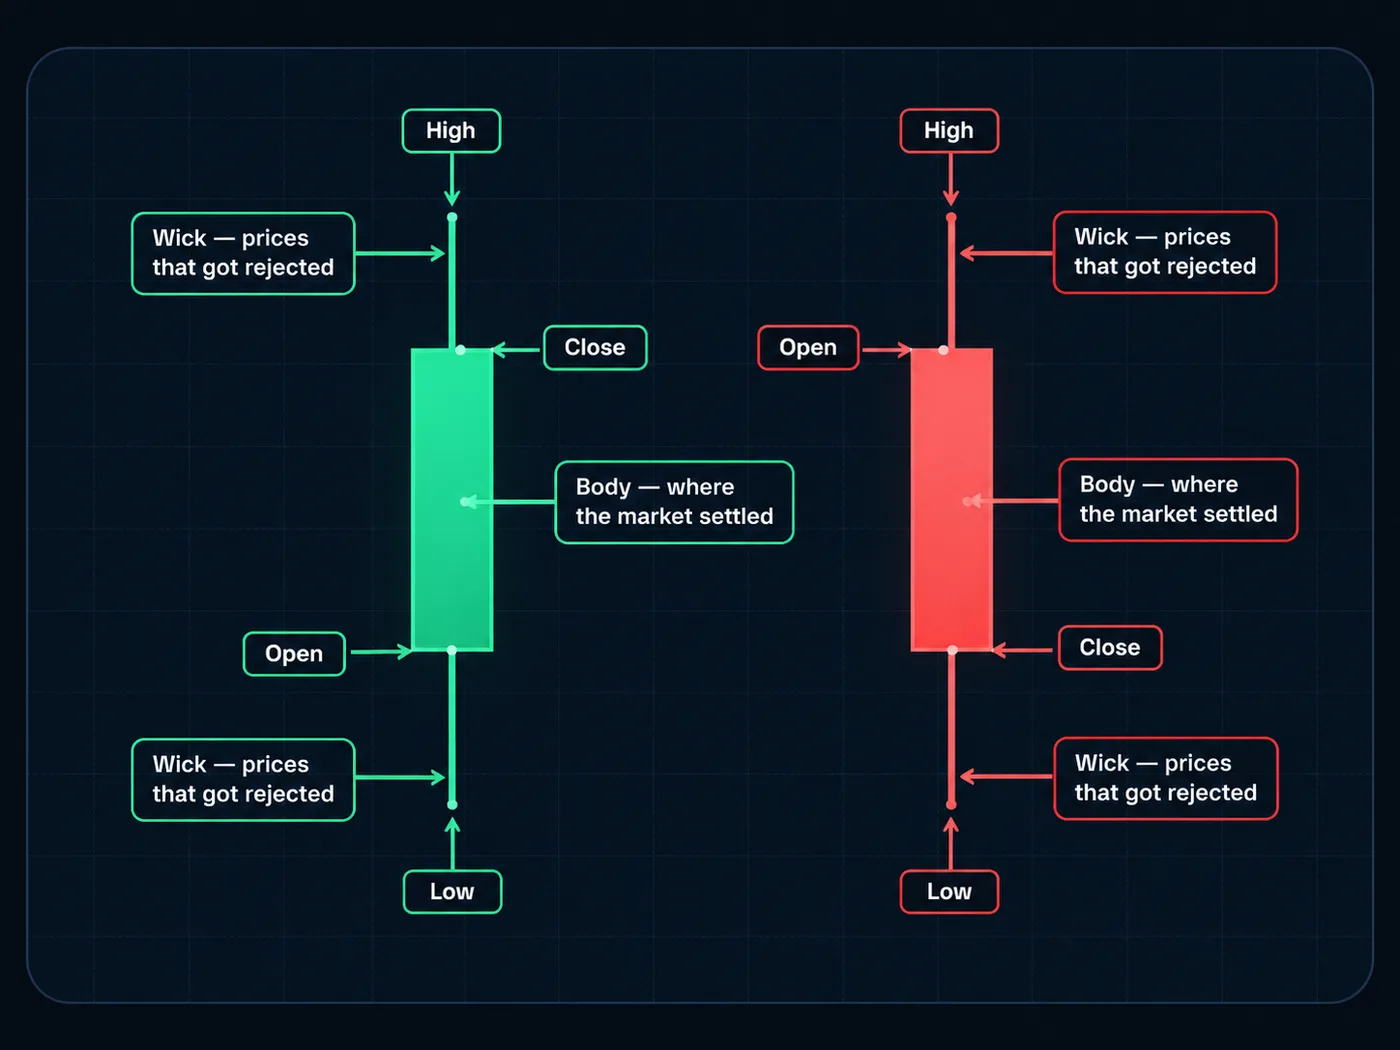
The exact shape
"Marubozu" is Japanese for "close-cropped", like a shaved head. The candle has no tails to speak of.
- Green (bullish) marubozu: it opens at the low and closes at the high.
- Red (bearish) marubozu: it opens at the high and closes at the low.
In real charts, a tiny tail on one end is common. Many traders still count it if the tails are very small next to the body.
New to bodies and tails? See how to read a candlestick chart.
A marubozu in numbers
A green example on a daily chart:
| Price | Value |
|---|---|
| Open | 30.00 |
| High | 32.00 |
| Low | 30.00 |
| Close | 32.00 |
Check it:
- Open = low (30.00). Price never traded below where it started.
- Close = high (32.00). Price finished at the very top.
- Body: 2.00, the whole candle.
What it says about buyers and sellers
Most candles show a back-and-forth. Tails are the proof that the other side had a turn.
A marubozu has no tails. So:
- In a green marubozu, sellers never got price below the open. Not once.
- Buyers pushed all the way to the close and were still pushing at the end.
That's one side in full control for the whole round. It's the strongest one-candle message there is.
But strong doesn't tell you what kind of strong. That depends on where it forms.
Where it matters: start or end?
1. Breaking out of a range or past a level. A green marubozu that closes above a resistance ceiling is our body-close rule at full strength. Not a tail poking through. A full body, closed at its high, past the level. See breakout vs fakeout. This is where a marubozu often marks a start.
2. Leaving a floor. A green marubozu pushing away from a support zone after a fall shows buyers arriving in force.
3. Late in a long run. A huge marubozu after weeks of rising can be the last rush of buying: everyone who was waiting finally jumps in at once. That can mark an end, or at least a pause. The same goes for a big red marubozu after a long fall.
To tell them apart, ask: is it leaving a level or running into one? Is it the first strong candle in a while, or the fifth?
Size matters too
Compare the marubozu's body with the last 10 or 20 candles.
- About normal size: a strong, clean candle. Good sign of control.
- Two or three times normal: something big happened. Often news. Check the economic calendar. Very big candles often pull back part of the way soon after.
Confirmation: the next body close
A marubozu already shows control. The next candle shows whether that control lasts.
For a green marubozu:
- Good: the next candle's body closes above the marubozu's middle. Here, above 31.00. Even better if it closes above 32.00.
- Warning: the next body closes below the middle. Half the push is gone in one candle.
For a red marubozu, flip it: the next close should stay below its middle.
Why the middle? A strong candle often gets "tested" the next day. Holding the top half says buyers are defending their gains. Losing it says the push was a one-off.
Where the stop goes
Here's the honest catch: a marubozu has no tail to hide a stop behind. You have two choices.
- Below the low (30.00 for our green one). The idea is wrong if the whole candle gets erased. Clear, but wide: the full body is your stop distance.
- Below the middle (31.00). Tighter, but easier to hit by a normal test of the candle.
A worked example:
- Enter on the next candle's close at 32.20.
- Stop at 29.90, just under the marubozu's low.
- Stop distance: 2.30.
The bigger the marubozu, the wider the stop and the smaller the size. Let the position size calculator do the math. Sometimes the right answer is to wait for a pullback into the candle and a closer stop.
When it fails
It fails often. That's why the stop comes first.
A failed green marubozu: the next candle or two close back inside the body, past the middle, and price falls through the low. The rush of buying ran out, or it was a news spike that faded.
Common mistakes
- Buying any big green candle. It needs to be all body, at a level that matters.
- Chasing a giant one. After a huge candle, the stop is far away and a pullback is common.
- Ignoring news. A marubozu on a big report can be a one-off.
Try it today
- Open a daily chart and use bar replay a year back.
- Find 10 candles with almost no tails.
- For each, write: is it leaving a level, breaking one, or running late into one? How big is it next to the last 10 candles?
- Step forward one candle. Did the next close hold the top half (or bottom half for red)?
Group your notes by "start" and "end" and see which ones held.
Questions
What is a marubozu candle?
A candle with a body and no tails. A green one opens at its low and closes at its high; a red one opens at its high and closes at its low. It shows one side in control the whole time.
Is a marubozu bullish or bearish?
A green marubozu shows strong buying, a red one strong selling. Whether it starts a move or ends one depends on where it forms, so check the level and the bigger chart.
Can a marubozu have small tails?
Yes. Real charts rarely show a perfect one. Most traders still count it if the tails are tiny next to the body.
Where should the stop go on a marubozu?
There's no tail to use, so it goes below the candle's low (wider) or below its middle (tighter). Either way, size the trade from that distance.
Want the next step? We'll walk you through it.
Four free lessons by email, one every few days — each with a 10-minute exercise on a real chart.
Send Me the Free Lessons 4 short emails · No spam · Unsubscribe anytimeOr see the whole method, step by step:
See What’s Inside the Course Try everything free first. Decide when you're ready. · Open the free chart tool (works in the TradingView phone app)One chart idea a day, in plain English. Follow along: