
Japanese Candlestick Charting Techniques: a plain-English Nison summary
Almost every chart you've seen uses candles. This is the book that made them popular outside Japan. Its best lesson isn't a pattern at all.
The book in one line
Japanese Candlestick Charting Techniques is by Steve Nison, first published in 1991. It's widely credited with introducing candlestick charts to Western traders.
Nison explains where candles came from, what each shape suggests about buyers and sellers, and how to combine candles with Western tools like support, resistance and trend lines.
The 5 ideas worth keeping
1. A candle is a short story about a fight
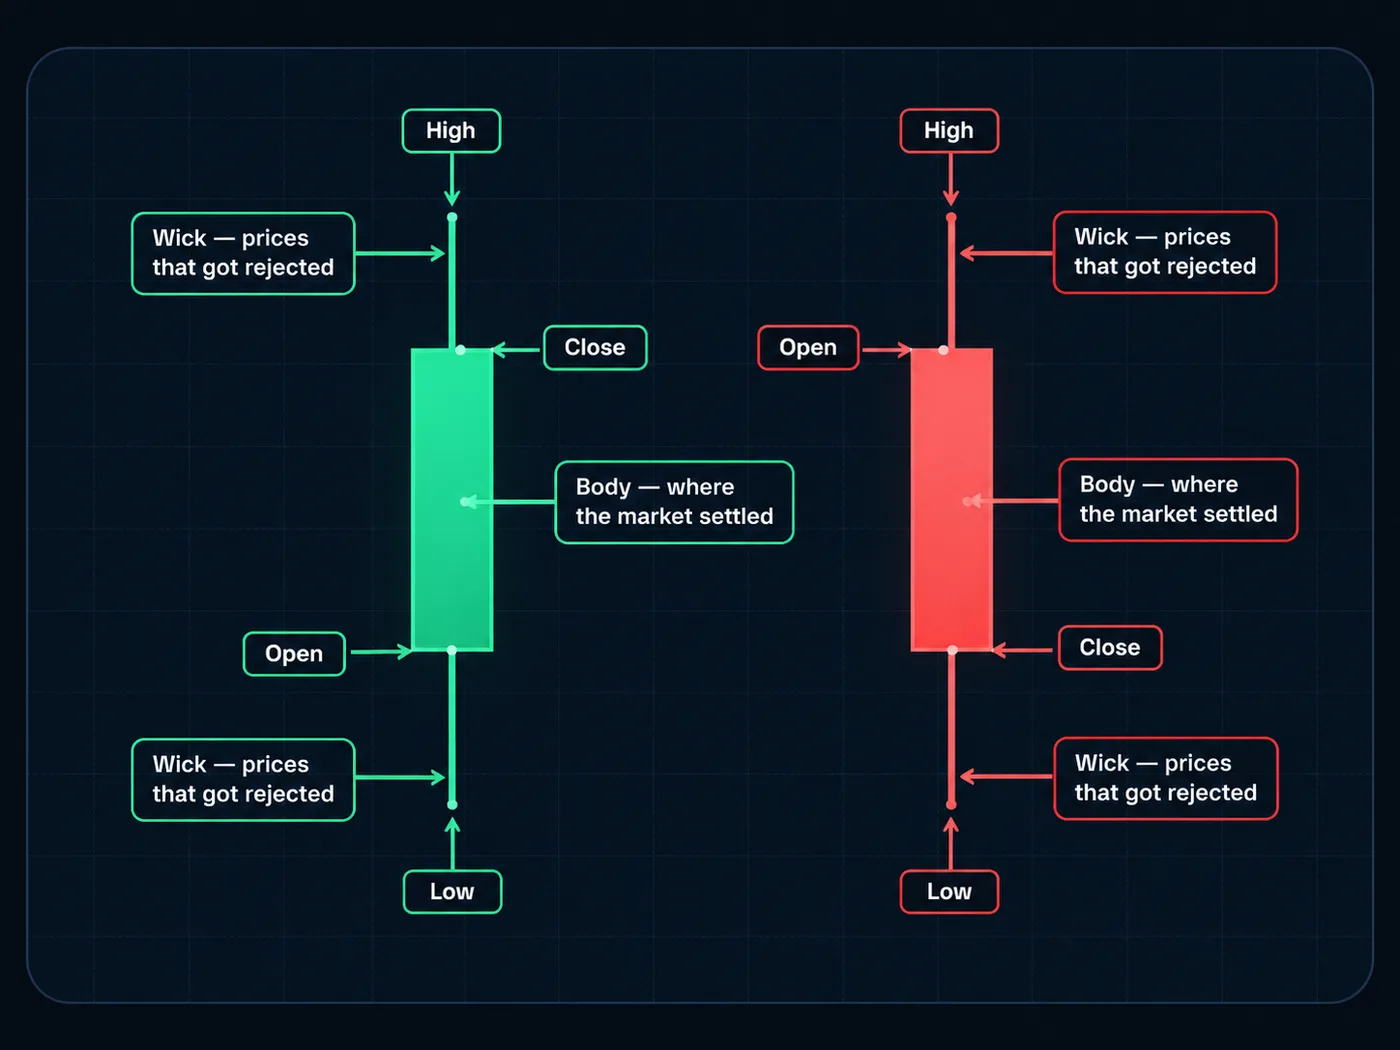
Each Candlestick shows four prices for one period: where it opened, the highest point, the lowest point, and where it closed. The thick part is the body. The thin lines are the wicks (or shadows).
Nison's gift is turning that into a story. A long body means one side clearly won the period. A long Wick means one side pushed hard, then got pushed back. See how to read candlestick charts.
2. The close matters most
Across the book, the close gets special weight. Where a candle finishes tells you who held control when the period ended.
We lean on this hard in our own method: only a candle body closing past a level counts as a real break. A wick poking through is just a test. Our breakout vs fakeout guide shows the difference.
3. Patterns have names, but they're just shapes
Nison describes many named patterns: the doji (open and close almost equal), the hammer, engulfing patterns, morning and evening stars, and more. The names are memorable, and they give traders a shared language.
You don't need to memorise dozens. A handful of common ones, understood well, is plenty. Our candlestick patterns for beginners picks the useful few.
4. Location beats the pattern
This is the lesson most readers skip. Nison stresses that a candle pattern means much more when it appears at an important place: near support, resistance, or after a long move.
A hammer in the middle of nowhere says little. The same hammer at a well-tested floor is worth a closer look. In plain words: where the candle forms matters more than what it looks like.
5. Candles work best with other tools
Nison doesn't pitch candles as a complete system. He shows how to use them alongside trend lines, moving averages and Volume. The candle tells you when something might be changing. The other tools tell you whether it matters.
That's also why a pattern alone is never a reason to skip your Stop loss. Even a perfect-looking signal can fail.
How to use it as a beginner
The book is long and detailed. Here's a focused way to use it:
- Learn the parts of a candle and the five or six most common patterns first.
- Open a daily chart and mark three clear support and resistance zones.
- Only study candle patterns that form at those zones. Ignore the rest.
- Practise with bar replay: stop the chart at a pattern, decide what you'd do, then step forward.
Keep a simple log: pattern, location, what happened next. After 20 examples, you'll know far more than a list of names could teach you.
One test for every candle: did the body close past the level, or just the wick? That single question filters out a lot of false signals.
Who it's for, and who should skip it
It's for you if you want to understand candles deeply, or you like knowing the history and reasoning behind a tool.
Skip it (for now) if you want a quick start. The full book is more than a beginner needs on day one. A short guide to the basics will get you reading charts sooner, and the book will make more sense after.
A gentle warning: the book's many patterns can tempt you to see signals everywhere. Fewer patterns, at better locations, is the healthier habit.
Read it with…
- Technical Analysis of the Financial Markets: the broader reference for the Western tools Nison pairs candles with.
- Reminiscences of a Stock Operator: a reminder that reading the chart is only half the job. Handling yourself is the other half.
Questions
Who introduced candlestick charts to the West?
Steve Nison is widely credited with it. His book Japanese Candlestick Charting Techniques came out in 1991.
Is Japanese Candlestick Charting Techniques good for beginners?
It's thorough and clear, but long. Beginners get the most from it after learning the basic candle parts and a few common patterns.
Do candlestick patterns really work?
They show what buyers and sellers did, but they fail often. They're most useful at important levels and combined with a stop and a clear plan.
What is the most important candlestick lesson?
Location. A pattern at a key level means more than the same pattern in the middle of a range, and the close matters more than the wick.
Want the next step? We'll walk you through it.
Four free lessons by email, one every few days — each with a 10-minute exercise on a real chart.
Send Me the Free Lessons 4 short emails · No spam · Unsubscribe anytimeOr see the whole method, step by step:
See What’s Inside the Course Try everything free first. Decide when you're ready. · Open the free chart tool (works in the TradingView phone app)One chart idea a day, in plain English. Follow along: