
How to read crypto charts, step by step
Crypto charts can look like noise at first. They aren't. They work like any other chart, with 3 quirks of their own. Here's how to read one, step by step.
Good news first
A crypto chart is a price chart like any other. If you can read one market, you can read this one.
The pieces:
- Candles show price over a set time.
- The trend shows which way price is heading.
- Turning points show where price last turned around.
Plus 3 crypto quirks, which we'll cover below.
Step 1: Know what one candle tells you
Each Candlestick shows 4 prices for its time period: open, high, low and close.
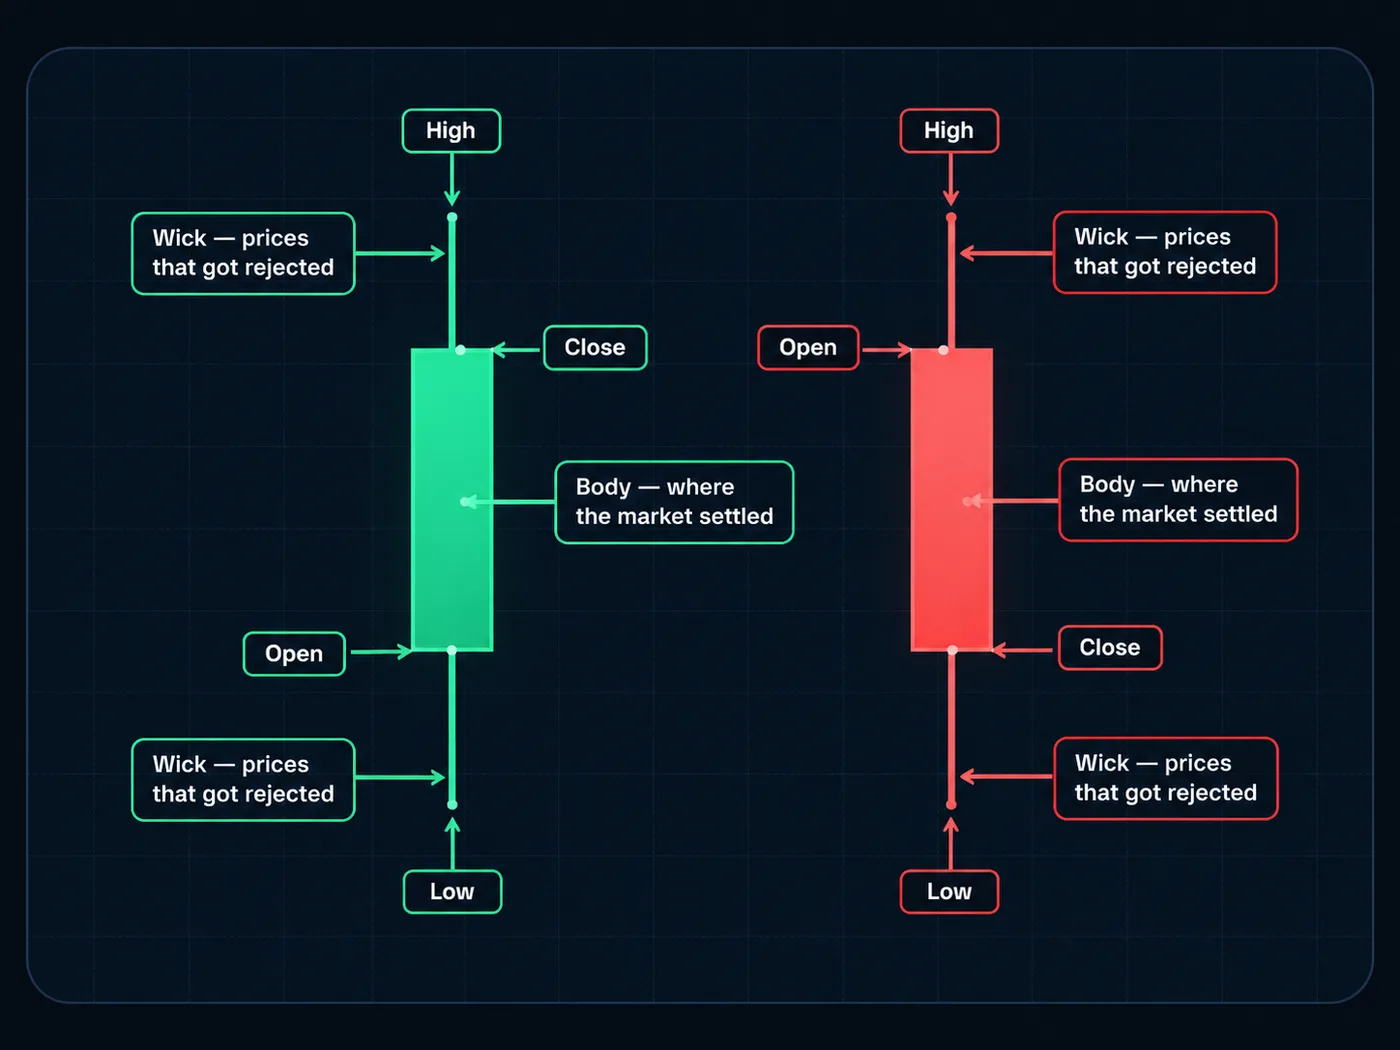
- The body is the thick part, from open to close. Green (or white) means it closed higher. Red (or black) means lower.
- The tails (Wicks) are the thin lines. They show how far price reached and got pushed back.
Our rule: the body is what counts. A tail poking past a level is just a test. A body closing past it means something. Our candlestick chart guide goes deeper.
Step 2: Pick your timeframes (start big)
A Timeframe is how much time each candle covers. Start big, then zoom in.
| Timeframe | Use it to |
|---|---|
| Weekly | See the big trend and the major turning points |
| Daily | Find the main trend you'll trade with |
| 4-hour or 1-hour | Plan an entry and a stop |
Always check the bigger chart first. If the daily is falling, buying on a 15-minute chart means trading against it. See multiple timeframe analysis.
Step 3: Find the trend
Look at the last few places price turned around.
- Uptrend: higher highs and higher lows. Each peak and each dip is above the last.
- Downtrend: lower highs and lower lows.
- Range: price bouncing between roughly the same high and low.
That's it. No indicator needed. See higher highs and higher lows.
Step 4: Mark the turning points
Mark the last clear peak and the last clear dip on your daily chart. These are your key levels.
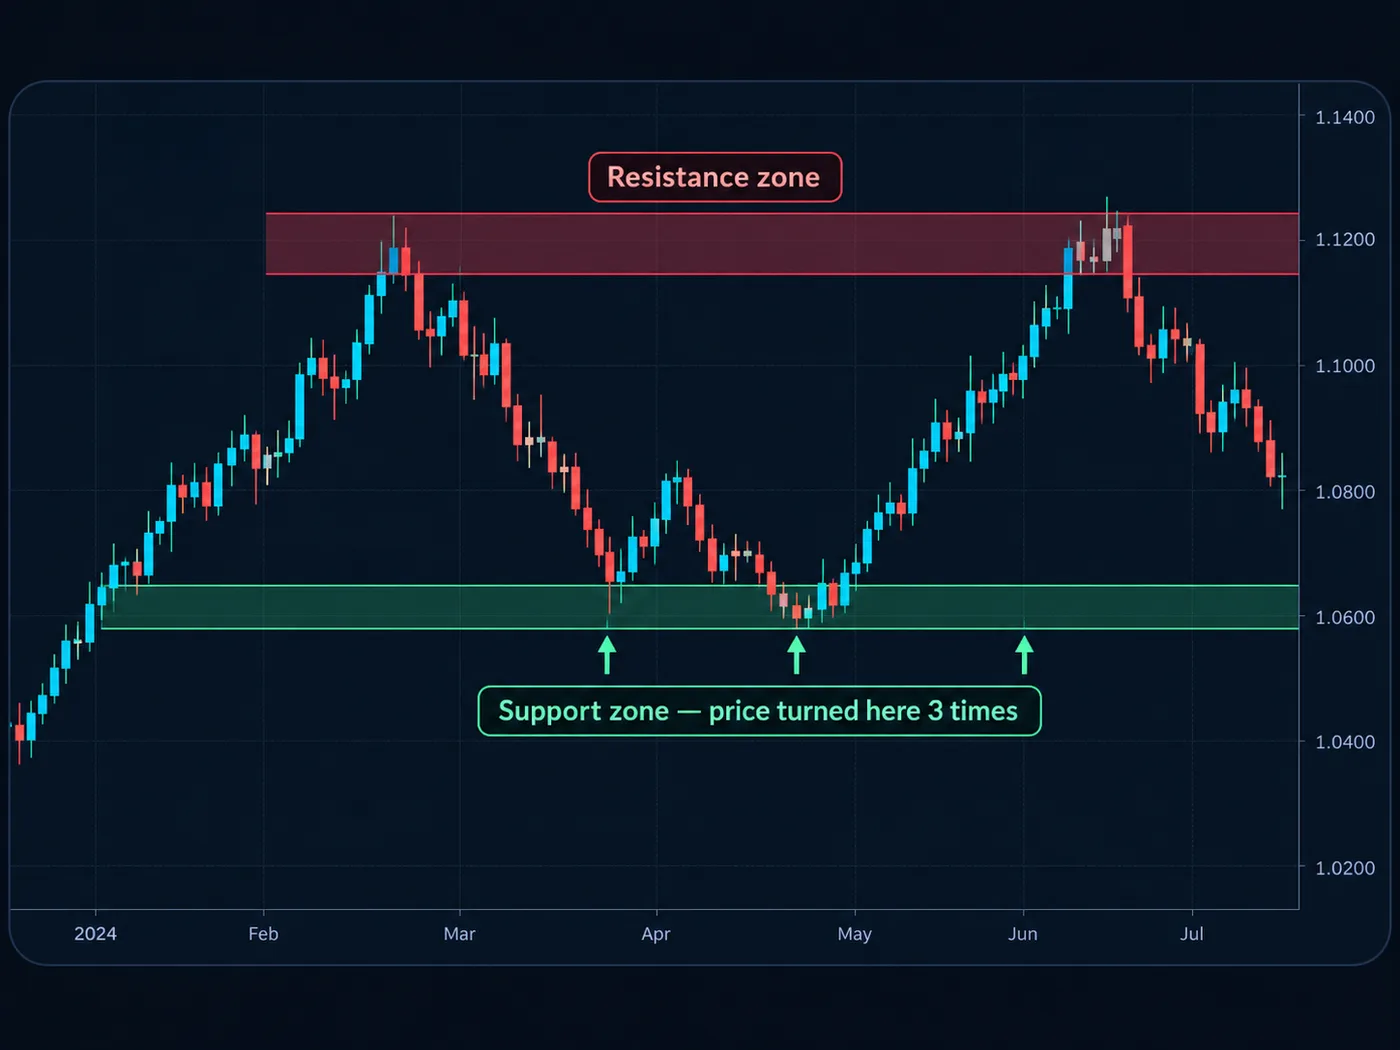
- The last dip is where buyers stepped in. It often acts as Support.
- The last peak is where sellers stepped in. It often acts as Resistance.
If you'd like help, the free StructureX chart tool on TradingView marks these turning points for you automatically. It works in the TradingView phone app too: search "StructureX" in Indicators.
Step 5: Wait for a candle body to close
When price reaches a level, don't react to the first poke.
- A tail through the level = a test. Often it snaps back. That's a possible Fakeout.
- A body closing past the level = the level has given way. That's the signal we wait for.
Our breakout vs fakeout guide explains why this one rule filters out a lot of noise.
The 3 crypto quirks
Quirk 1: It never closes, so "the close" is a choice
Stocks close at 4 pm ET. Crypto trades 24/7, including weekends.
So when does a daily candle close? On most platforms, at midnight UTC. That's 8 pm ET in summer (daylight time) and 7 pm ET in winter.
Different platforms can use different times, so daily candles may not match exactly. Pick one platform's chart and stick to it.
Quirk 2: Weekends and quiet hours are thinner
There's no closing bell, but there are quieter times. Weekends and late-night hours often have less trading.
Less trading can mean:
- wider Spreads,
- sudden spikes that reverse,
- tails that poke through levels and snap back.
Another reason to wait for a body close.
Quirk 3: Each exchange has its own chart
Bitcoin trades on many exchanges. Each one has its own price, volume and candles. They're usually close, but not identical.
- Price differences are usually tiny for big coins.
- Volume numbers can differ a lot, so compare volume on the same exchange over time, not across exchanges.
Use a log scale for long-term charts
On a normal chart, a move from $1,000 to $2,000 looks tiny next to a move from $50,000 to $51,000. But the first one doubled. The second rose 2%.
A log scale shows percent moves fairly. On TradingView, look for the "log" option near the bottom right of the chart. Use it for weekly and monthly crypto charts.
Put it together: a worked example
Here's how we'd walk through a bitcoin chart. An illustration with round numbers, not a trade idea.
- Weekly: higher highs and higher lows. The big trend is up.
- Daily: the last clear dip was at $58,000. The last clear peak was at $64,000.
- Wait: price pulls back toward $60,000, then a daily body closes back above $61,000, the last small peak. That's our signal, and $61,000 is the entry.
- Stop: below the last dip, at $57,800, where the idea is clearly wrong.
- Size: account $2,000, risk 1% = $20. Stop distance $61,000 − $57,800 = $3,200. Size = $20 ÷ $3,200 = 0.00625 BTC, about $380 worth.
If the stop is hit, the loss is about $20 plus fees. Losses like this will happen, and that's why the size comes from the stop. The position size calculator does the math.
Common crypto chart mistakes
- Starting on the 1-minute chart. Tiny charts are full of noise. Start on the daily.
- Stacking indicators until the price is hard to see. Price and turning points come first.
- Trusting one wick. Crypto has lots of sharp tails, often from forced closes of leveraged trades.
- Forgetting bitcoin. Most altcoins tend to follow bitcoin on big moves. Check bitcoin's chart before an altcoin's.
- Comparing volume across exchanges. Compare one exchange to itself.
Try it today: open the BTC/USD daily chart on TradingView and turn on bar replay. Go back 6 months, hide the future, and mark the trend and the last 2 turning points. Then play it forward a candle at a time. See TradingView bar replay for how.
Questions
How do you read a crypto chart for beginners?
Start on the daily chart. Find the trend by looking for higher highs and higher lows (or the reverse), mark the last places price turned around, and wait for a candle body to close past a level before acting.
What time does the daily crypto candle close?
On most platforms, at midnight UTC, which is 8 pm ET during daylight saving time and 7 pm ET otherwise. Some platforms use different times, so check yours.
What is the best timeframe for crypto charts?
There's no single best one. Many beginners use the weekly for the big picture, the daily for the trend, and the 4-hour or 1-hour to plan entries and stops.
Should I use a log scale on crypto charts?
For long-term charts, yes. A log scale shows percent moves fairly, so big early moves don't look flat next to later ones.
Why do crypto charts look different on different exchanges?
Each exchange has its own buyers, sellers and trades, so prices, tails and volume can differ a little. Pick one chart source and use it consistently.
Want the next step? We'll walk you through it.
Four free lessons by email, one every few days — each with a 10-minute exercise on a real chart.
Send Me the Free Lessons 4 short emails · No spam · Unsubscribe anytimeOr see the whole method, step by step:
See What’s Inside the Course Try everything free first. Decide when you're ready. · Open the free chart tool (works in the TradingView phone app)One chart idea a day, in plain English. Follow along: